U.S. trading hours have quietly shifted back into net buying mode for Bitcoin, even as Asian sessions continue to drive most of the selling. Session data from Velo shows U.S. flows pushing cumulative returns into positive territory for the week, while APAC remains deeply negative.
US Session Turns Net Buyer as Asia Extends Bitcoin Selling
Bitcoin session data from Velo shows U.S. trading hours have flipped back into positive territory, with cumulative returns now sitting above zero for the week. The blue U.S. line on the chart drops early but then climbs steadily, jumping sharply around Nov. 24–25 and holding near a roughly 2 percent gain by Nov. 26.
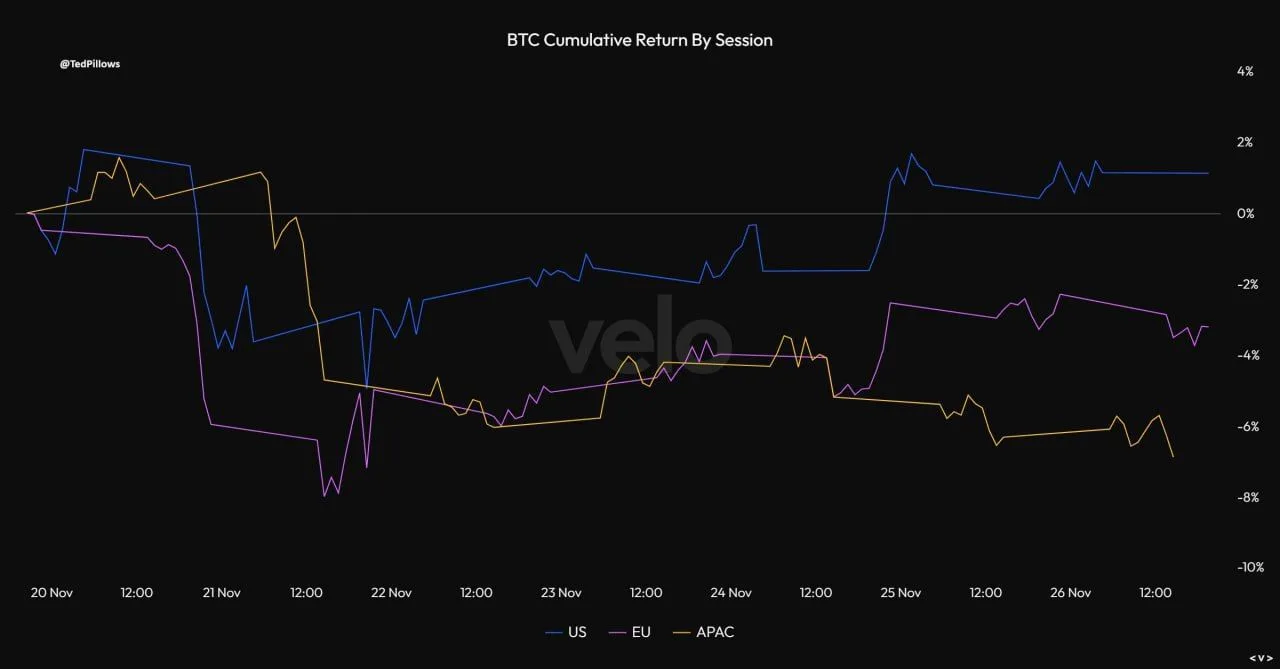
BTC Cumulative Return by Session. Source: Velo / X
By contrast, European hours remain negative even after a mid-week recovery. The purple line sinks deeply on Nov. 21, then edges higher but still ends the period several percentage points below the flat line. This suggests Europe is no longer leading the sell-side pressure, yet buyers there have not fully reversed the earlier drawdown.
Asia continues to show the weakest profile. The yellow APAC line slides soon after Nov. 20 and spends most of the week between roughly minus 5 and minus 7 percent. Ted Pillows, who shared the chart, noted that Asian hours have again been the dominant selling window for Bitcoin this year, while U.S. traders are once more providing net demand.
Crypto Fear and Greed Index Returns to Extreme Fear at 20
Meanwhile, crypto sentiment has dropped back into “extreme fear” even as Bitcoin trades far below its prior peak. The latest Crypto Fear and Greed Index reading stands at 20, double last week’s score of 10 when Bitcoin briefly touched 80,000 dollars, according to data shared by Coin Bureau. The outlet added that today’s mood mirrors the atmosphere when BTC hovered near 100,000 dollars.
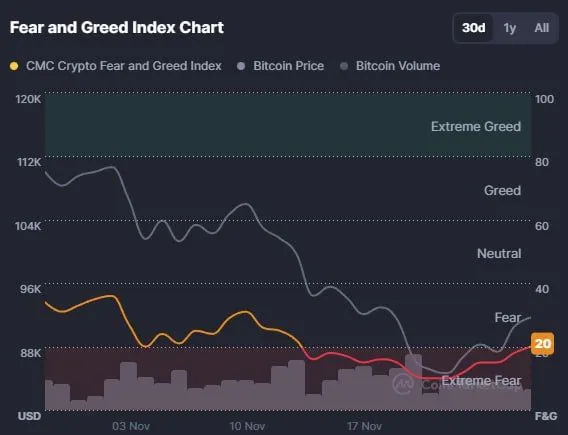
Crypto Fear and Greed Index Chart. Source: CoinMarketCap / Coin Bureau
The 30-day chart shows the index sliding from higher levels earlier in November toward the red “extreme fear” band as prices trended lower. Bitcoin’s line on the graphic falls from above 110,000 dollars to below 90,000 dollars over the period, while volume bars remain relatively steady in the background. Together, the curves illustrate how risk appetite has eroded during the pullback.
Now, with the index pinned near 20, traders once again display the same risk-off posture seen around Bitcoin’s former highs. The combination of lower prices and depressed sentiment underscores how sharply attitudes have reset, even though on-chain and derivatives metrics may point to different positioning across the market.
Bitcoin On-Chain Data Marks 84,570 Dollars as Key Support, 112,340 Dollars as Top Band
On-chain data from Glassnode’s UTXO Realized Price Distribution shows dense Bitcoin supply around 84,570 dollars. Analyst Ali said this level now acts as the “support that matters,” since a large share of coins last moved near that price, creating a strong holder base in that band.
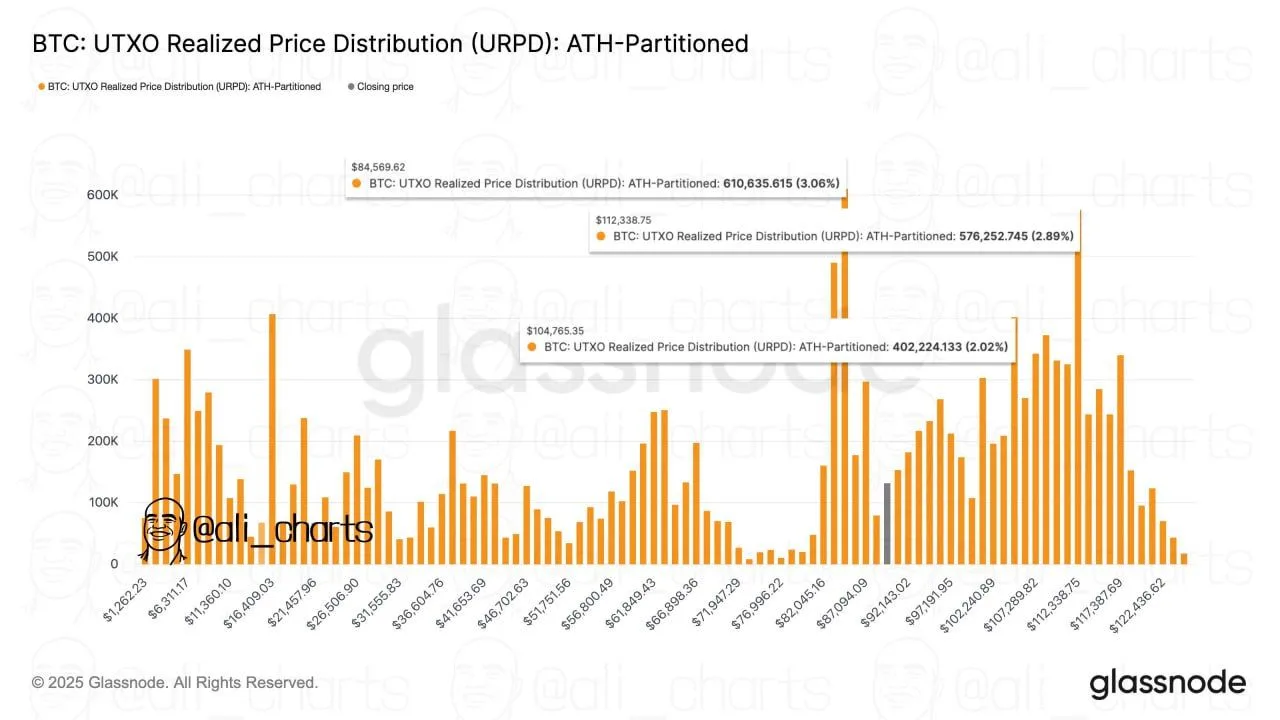
Bitcoin UTXO Realized Price Distribution URPD. Source: Glassnode / Ali Charts
Above the market, the same URPD chart highlights another heavy cluster near 112,340 dollars. Ali described this area as the ceiling to watch, as many coins changed hands there when Bitcoin traded close to its all-time high. Those holders may choose to sell or defend positions if price revisits the range.
Together, the two bands outline a broad on-chain corridor where realized prices concentrate. The 84,570 dollar zone signals where downside may meet reinforced demand, while 112,340 dollars marks the upper area where previously active supply could reappear.