Key takeaways
- BTC is trading at $89k after losing less than 1% of its value in the last 24 hours.
- The leading cryptocurrency could top the $90k resistance level in the near term.
BTC trades below $90k
The cryptocurrency market has opened the new weekly candle bearish, with Bitcoin and other major cryptocurrencies currently in the red. Bitcoin (BTC), Ethereum (ETH), and Ripple (XRP) are currently trading around key levels after correcting slightly over the past few days.
The three leading cryptocurrencies by market cap could record further losses in the near term as bearish momentum builds across key indicators.
At the moment, traders and investors are closely monitoring critical support zones for signs of stabilization or a deeper corrective move.
Traders are keeping an eye on upcoming macroeconomic events in the global financial markets. In the U.S, the events include the unemployment rate, ADP employment data, and weekly jobless claims, alongside November inflation data, and December flash PMI readings.
Furthermore, the speeches from Federal Reserve Governors Stephen Miran and Christopher J. Waller could give investors clues on the path of interest rates.
The Bank of Japan is also expected to raise interest rates to 0.75% at its upcoming policy meeting on Thursday.
Bitcoin could face further correction
The BTC/USD 4-hour chart is bearish and efficient as Bitcoin has underperformed in recent days. The cryptocurrency faced rejection from the descending trendline last week, failing to overcome the $94k resistance level. As of Monday, BTC hovers around $89,000.
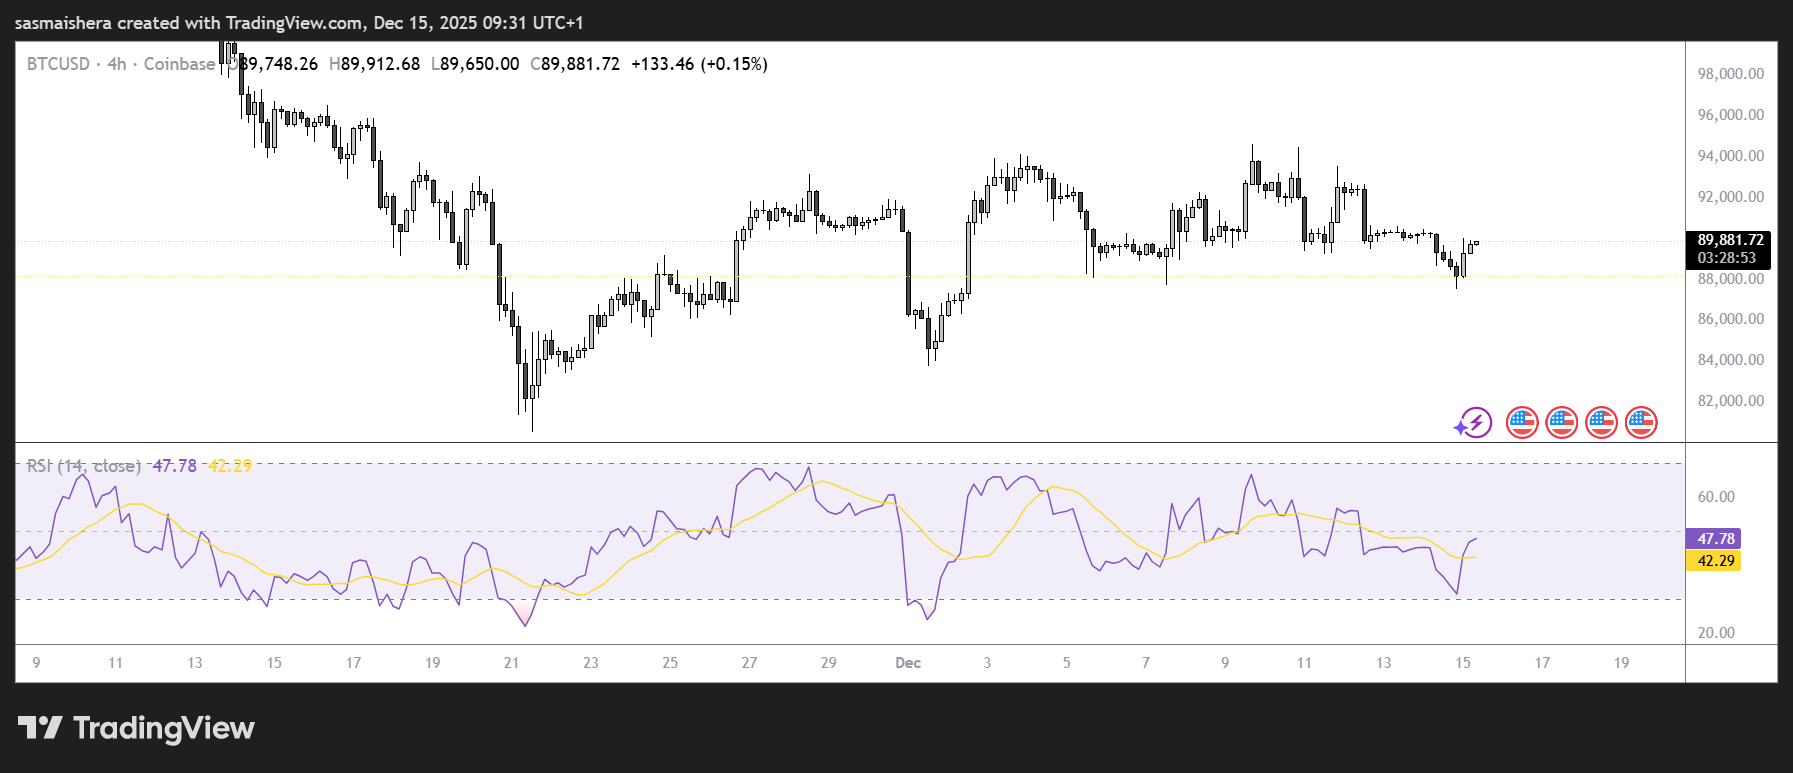
If the bearish trend continues, Bitcoin could sink lower towards the next key support level at $85,569. However, this support level remains strong at the moment.
The Relative Strength Index (RSI) on the 4-hour chart is at 42, below its neutral level of 50, indicating bearish momentum is gaining traction. Furthermore, the Moving Average Convergence Divergence (MACD) lines are converging, and a flip to a bearish crossover could add additional confluence for the bears.
If the bulls regain control and Bitcoin breaks above the $94k resistance level, it could extend its rally toward the $100,000 psychological level.