Bulls remain more powerful than bears today, according to CoinMarketCap.
BTC/USD
Bitcoin (BTC) is the exeption to the rule, falling by 0.44% over the last 24 hours.

On the hourly chart, the rate of BTC is on its way to the local support at $93,121. If sellers’ pressure continues, one can expect a level breakout, followed by a further drop to the $92,500-$93,000 range.
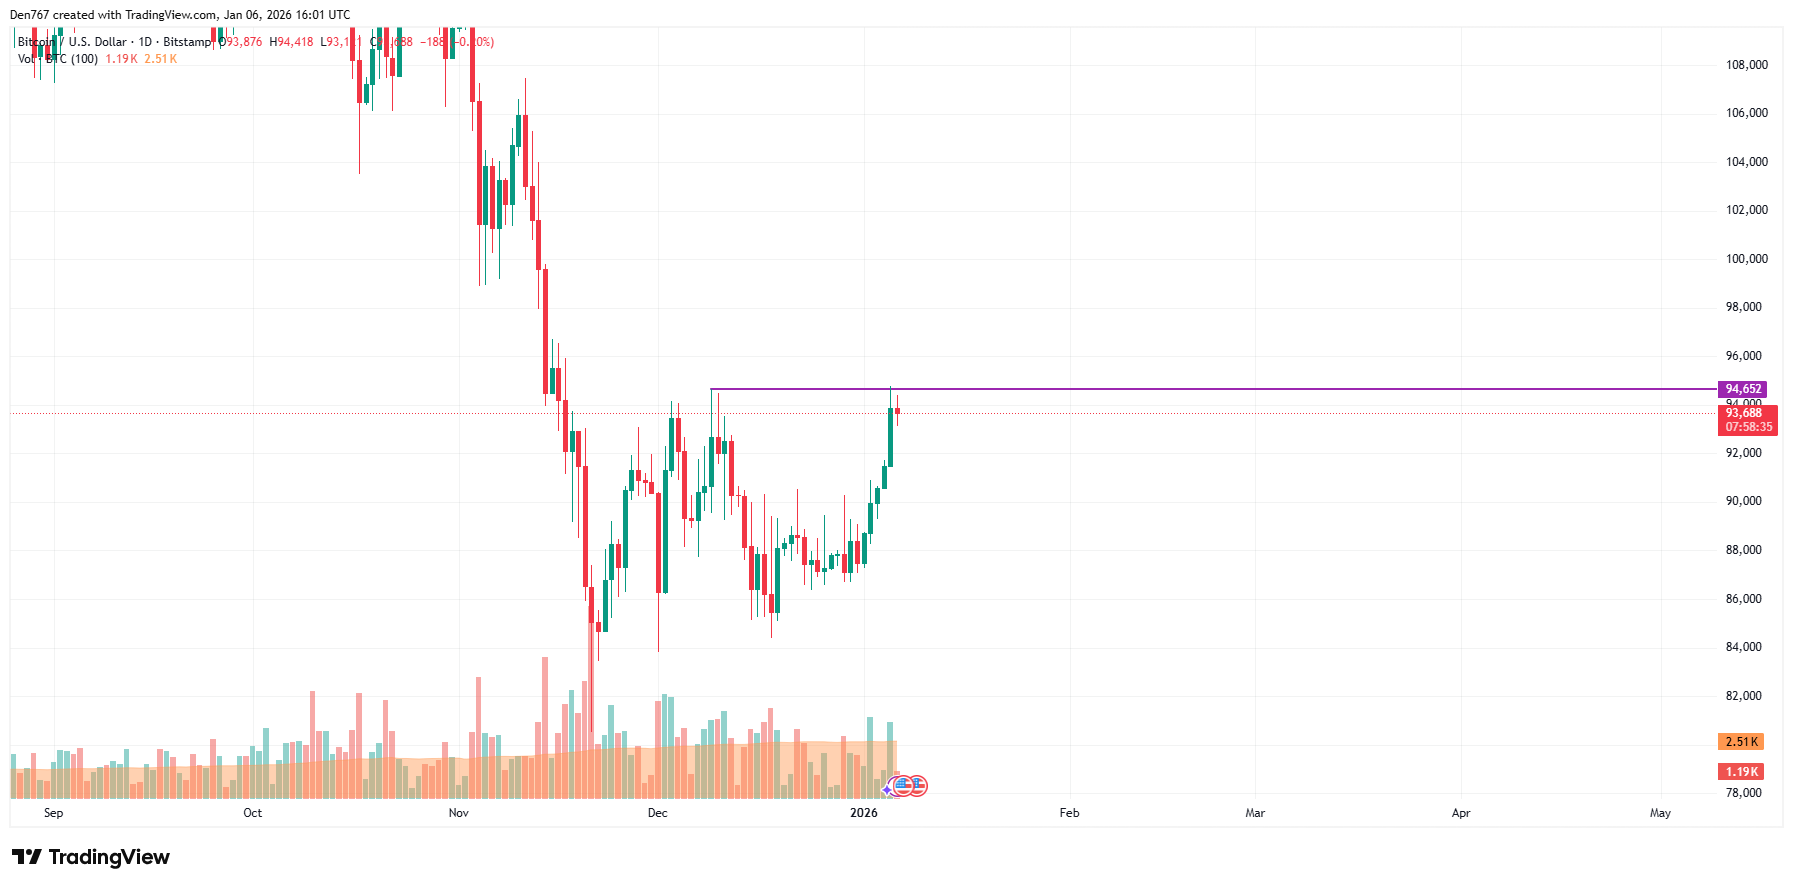
On the longer time frame, the price of the main crypto has made a false breakout of the formed resistance at $94,652.
If the daily bar closes far from that mark, there is a high chance of seeing a test of the $92,000-$93,000 area this week.
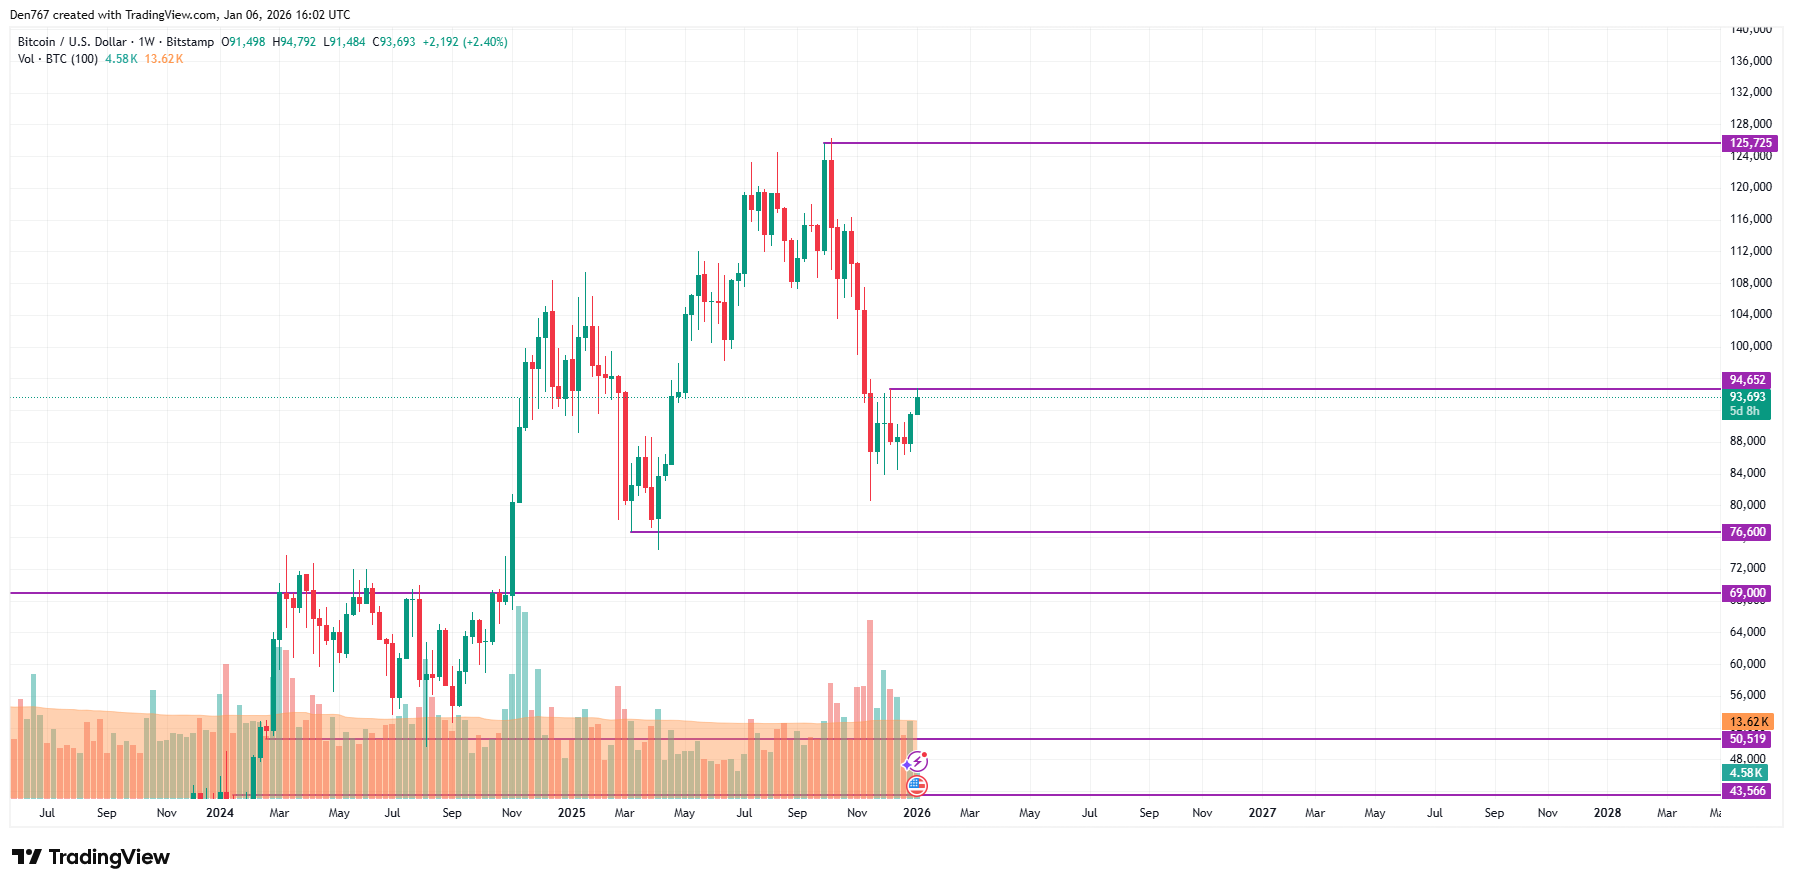
From the midterm point of view, traders should focus on the nearest level of $94,652. If bulls can hold the gained initiative, the accumulated energy might be enough for a blast to the $100,000 area.
Bitcoin is trading at $93,724 at press time.