
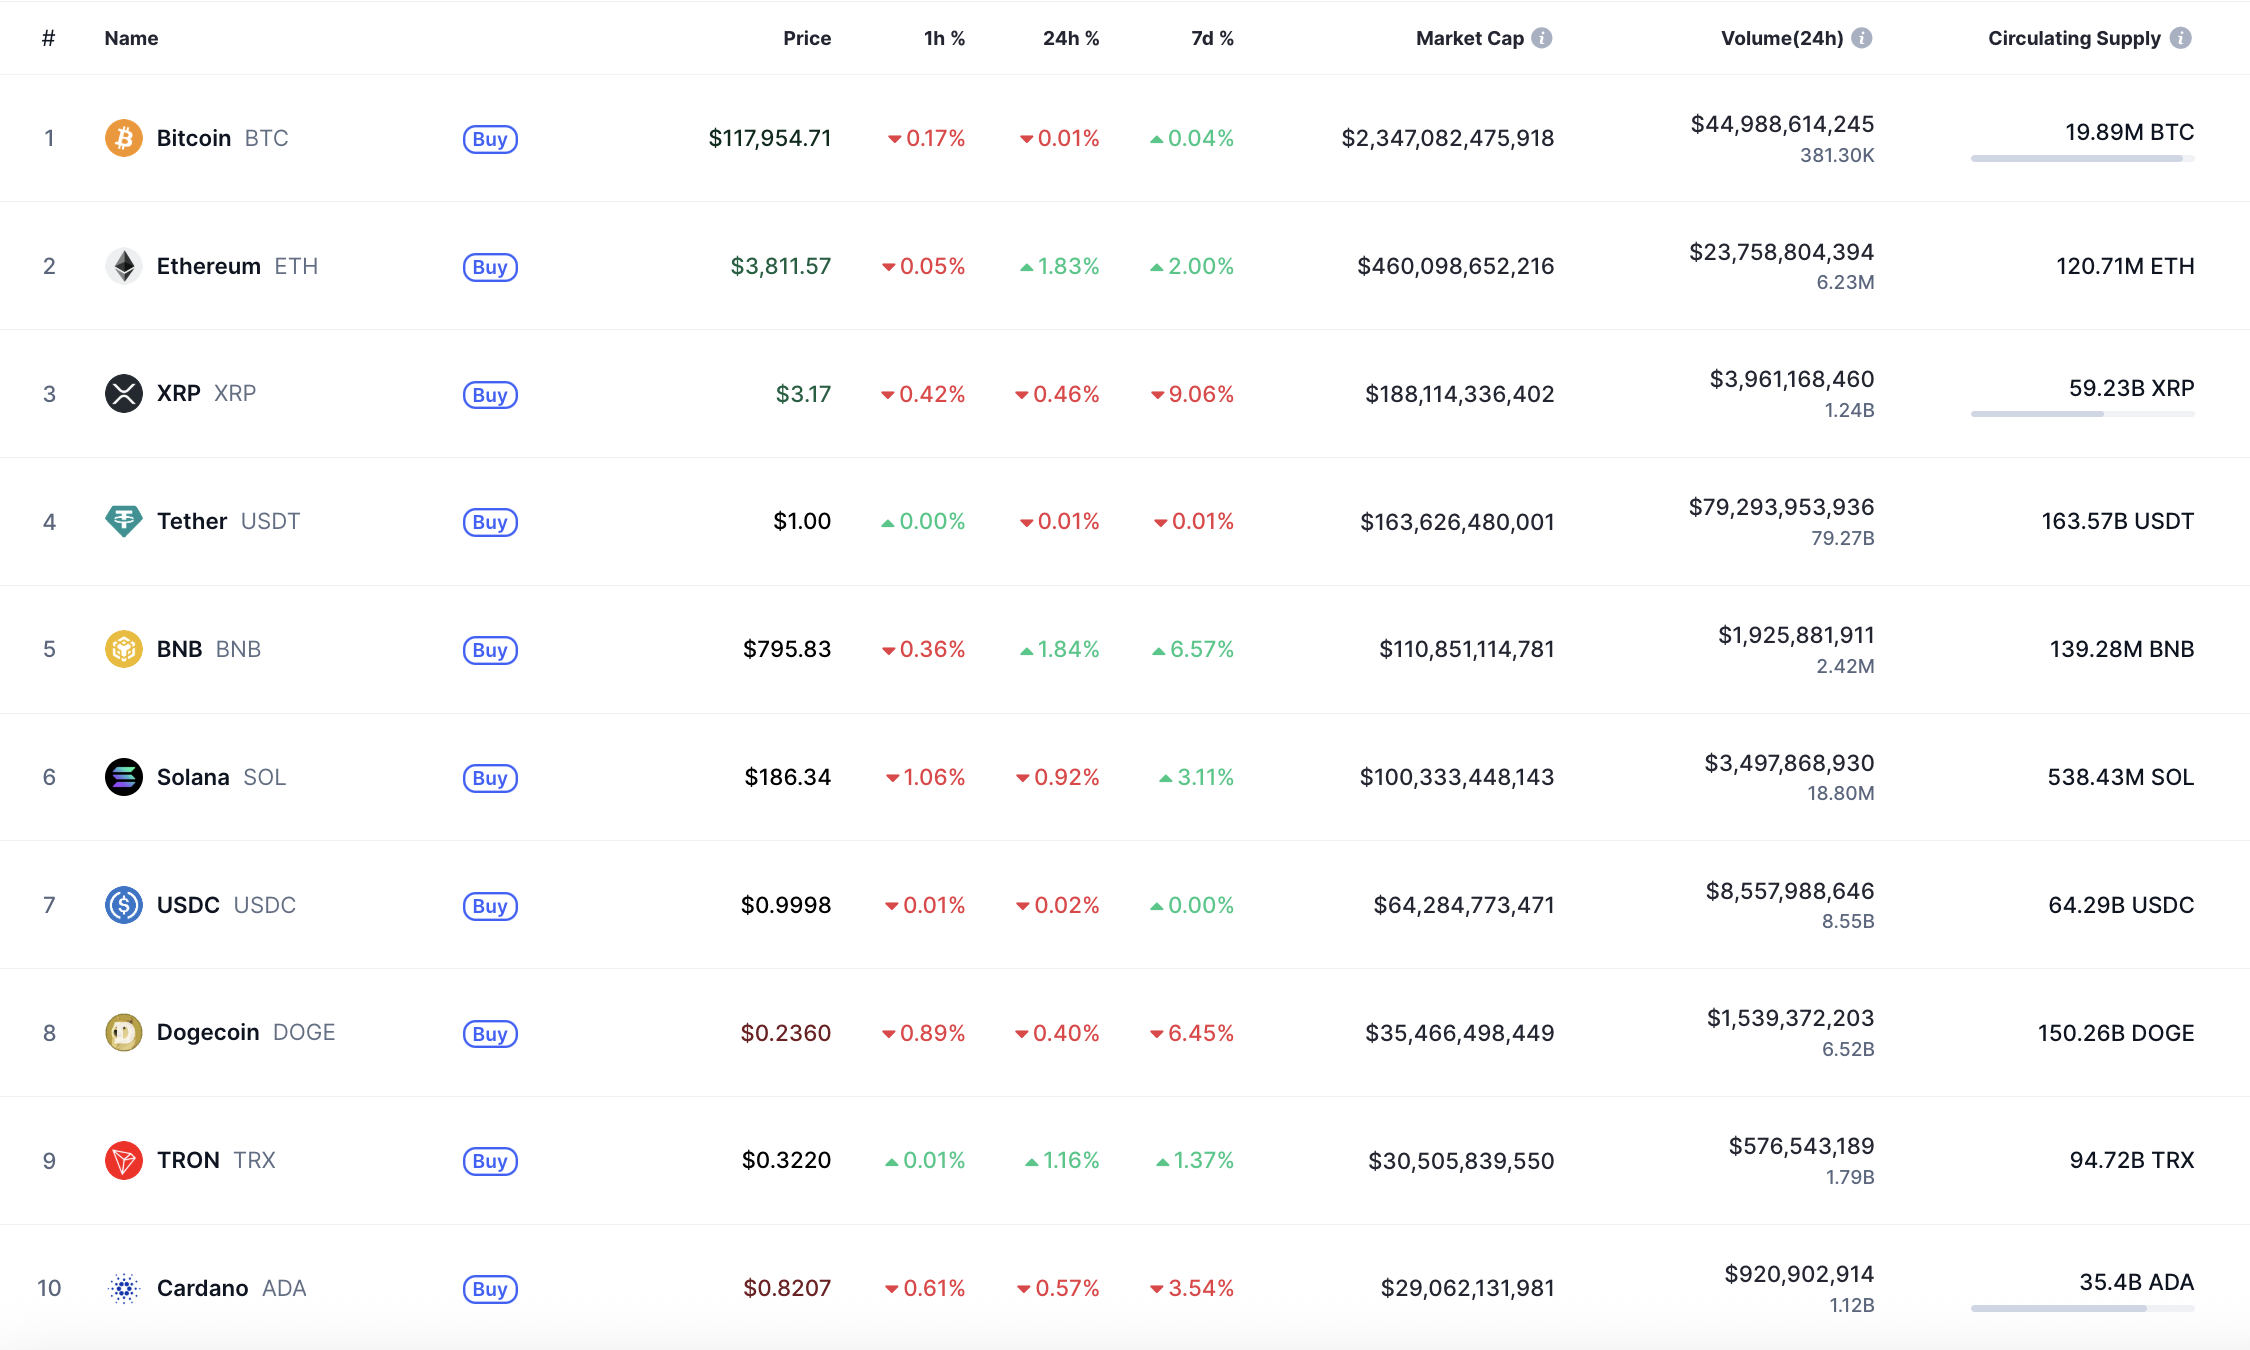
Most of the cryptocurrencies are in the red zone at the end of the week, according to CoinMarketCap.
BTC/USD
The rate of Bitcoin (BTC) has remained the same since yesterday and over the past week.
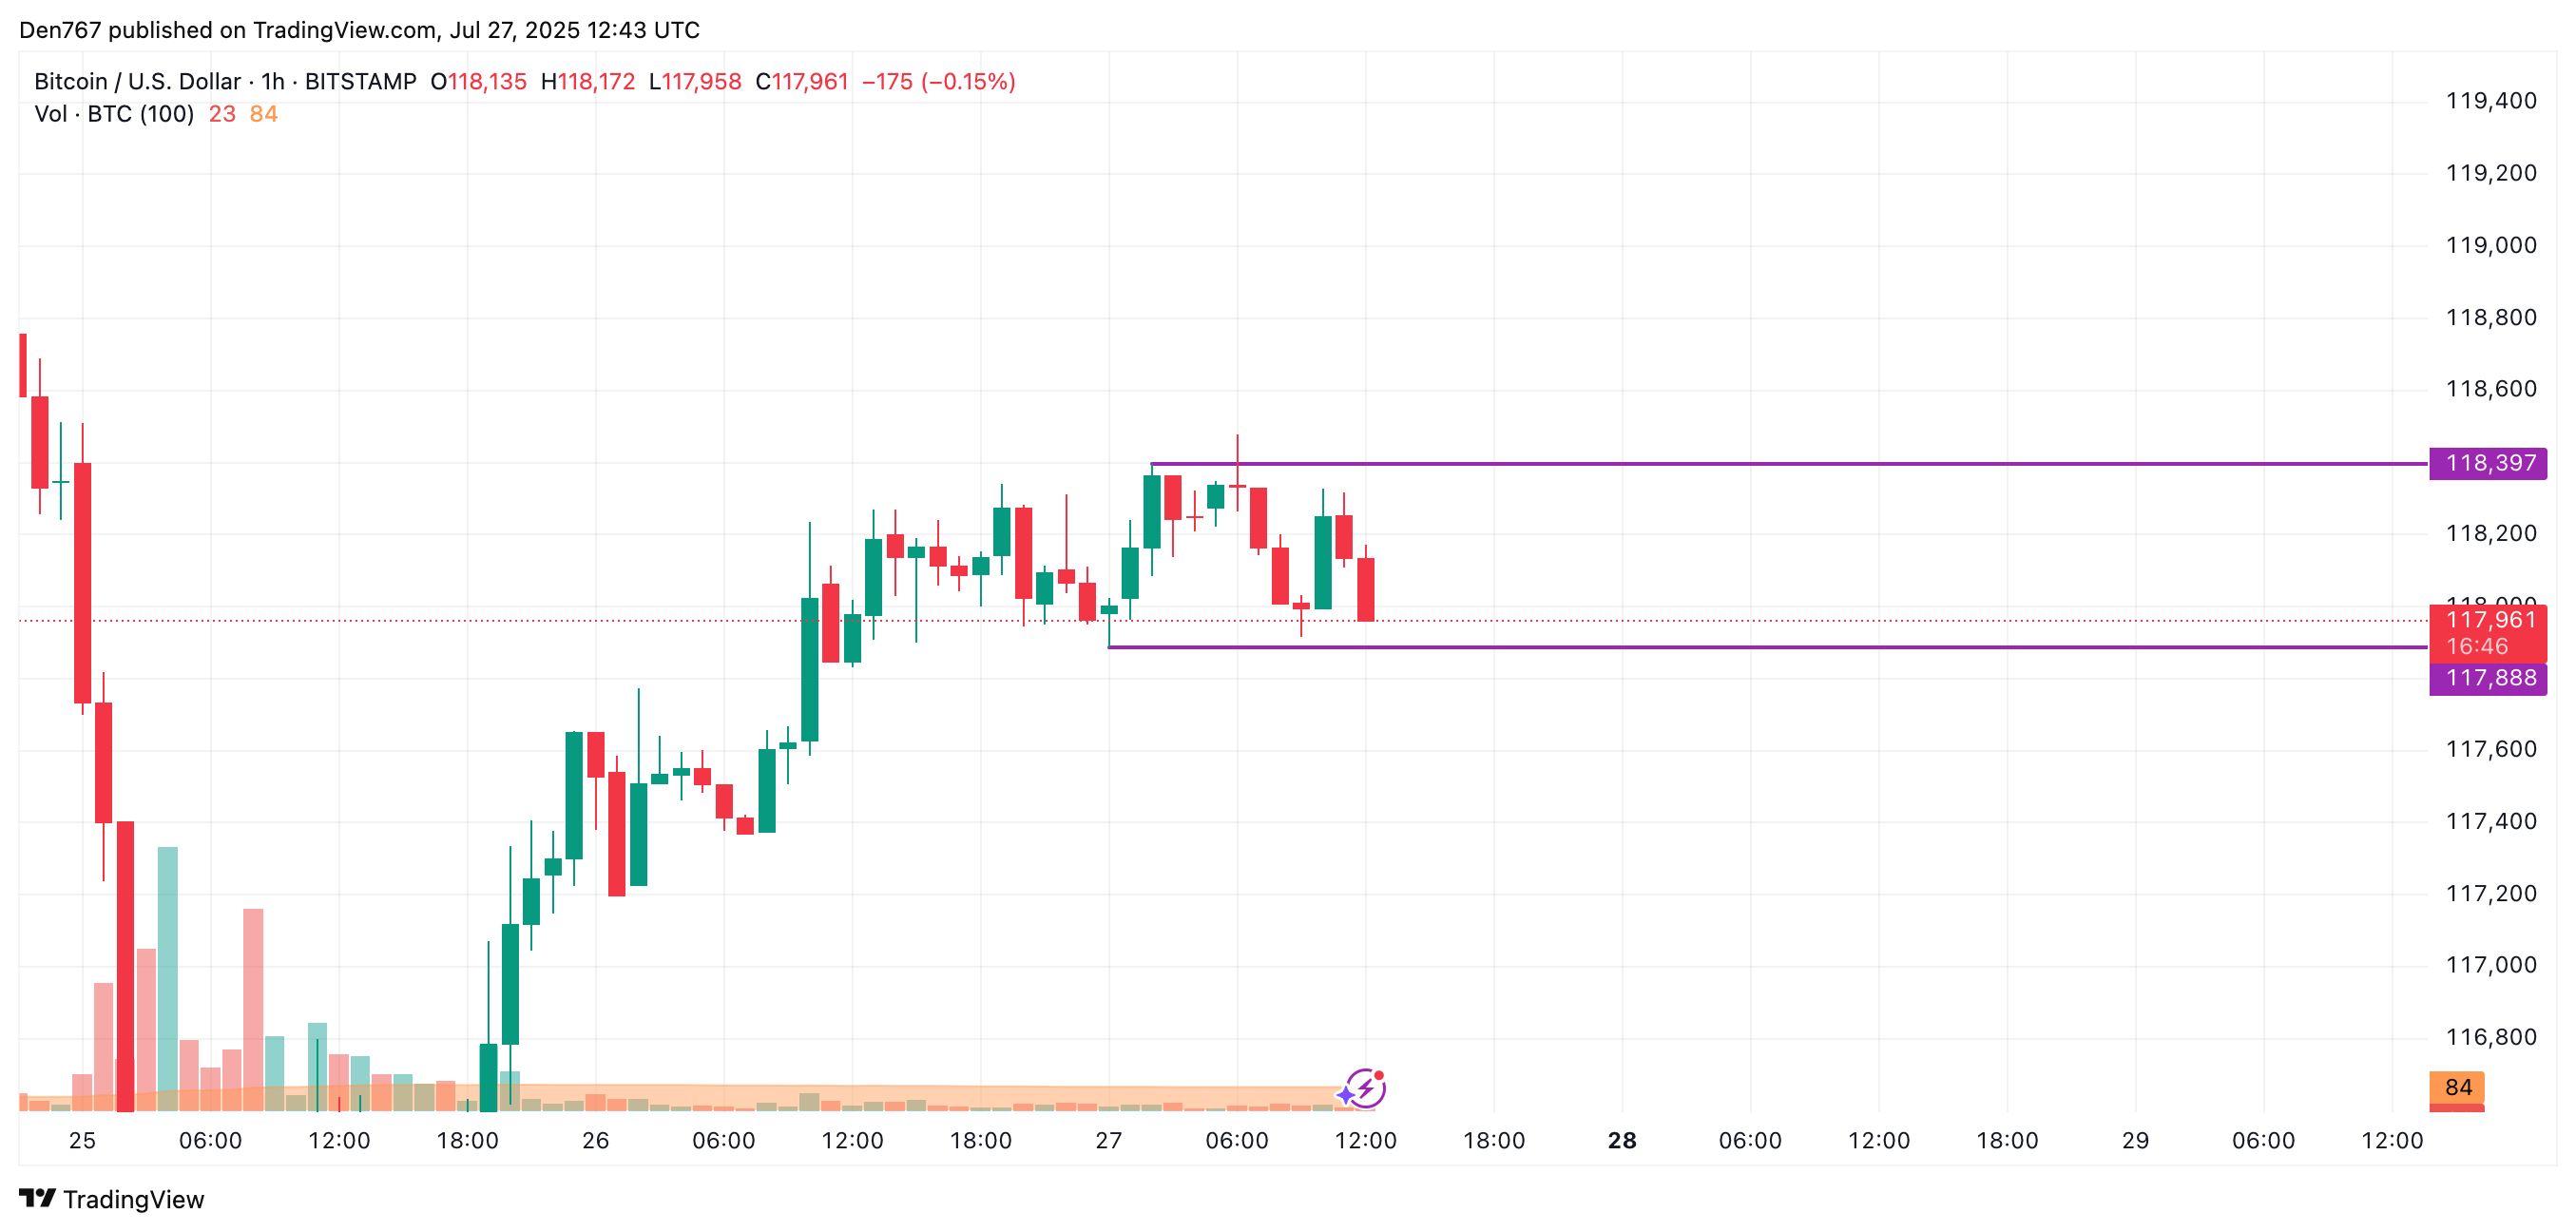
On the hourly chart, the price of the main crypto is approaching the local support of $117,888. If a breakout happens, the accumulated energy might be enough for a test of the $117,500 range soon.
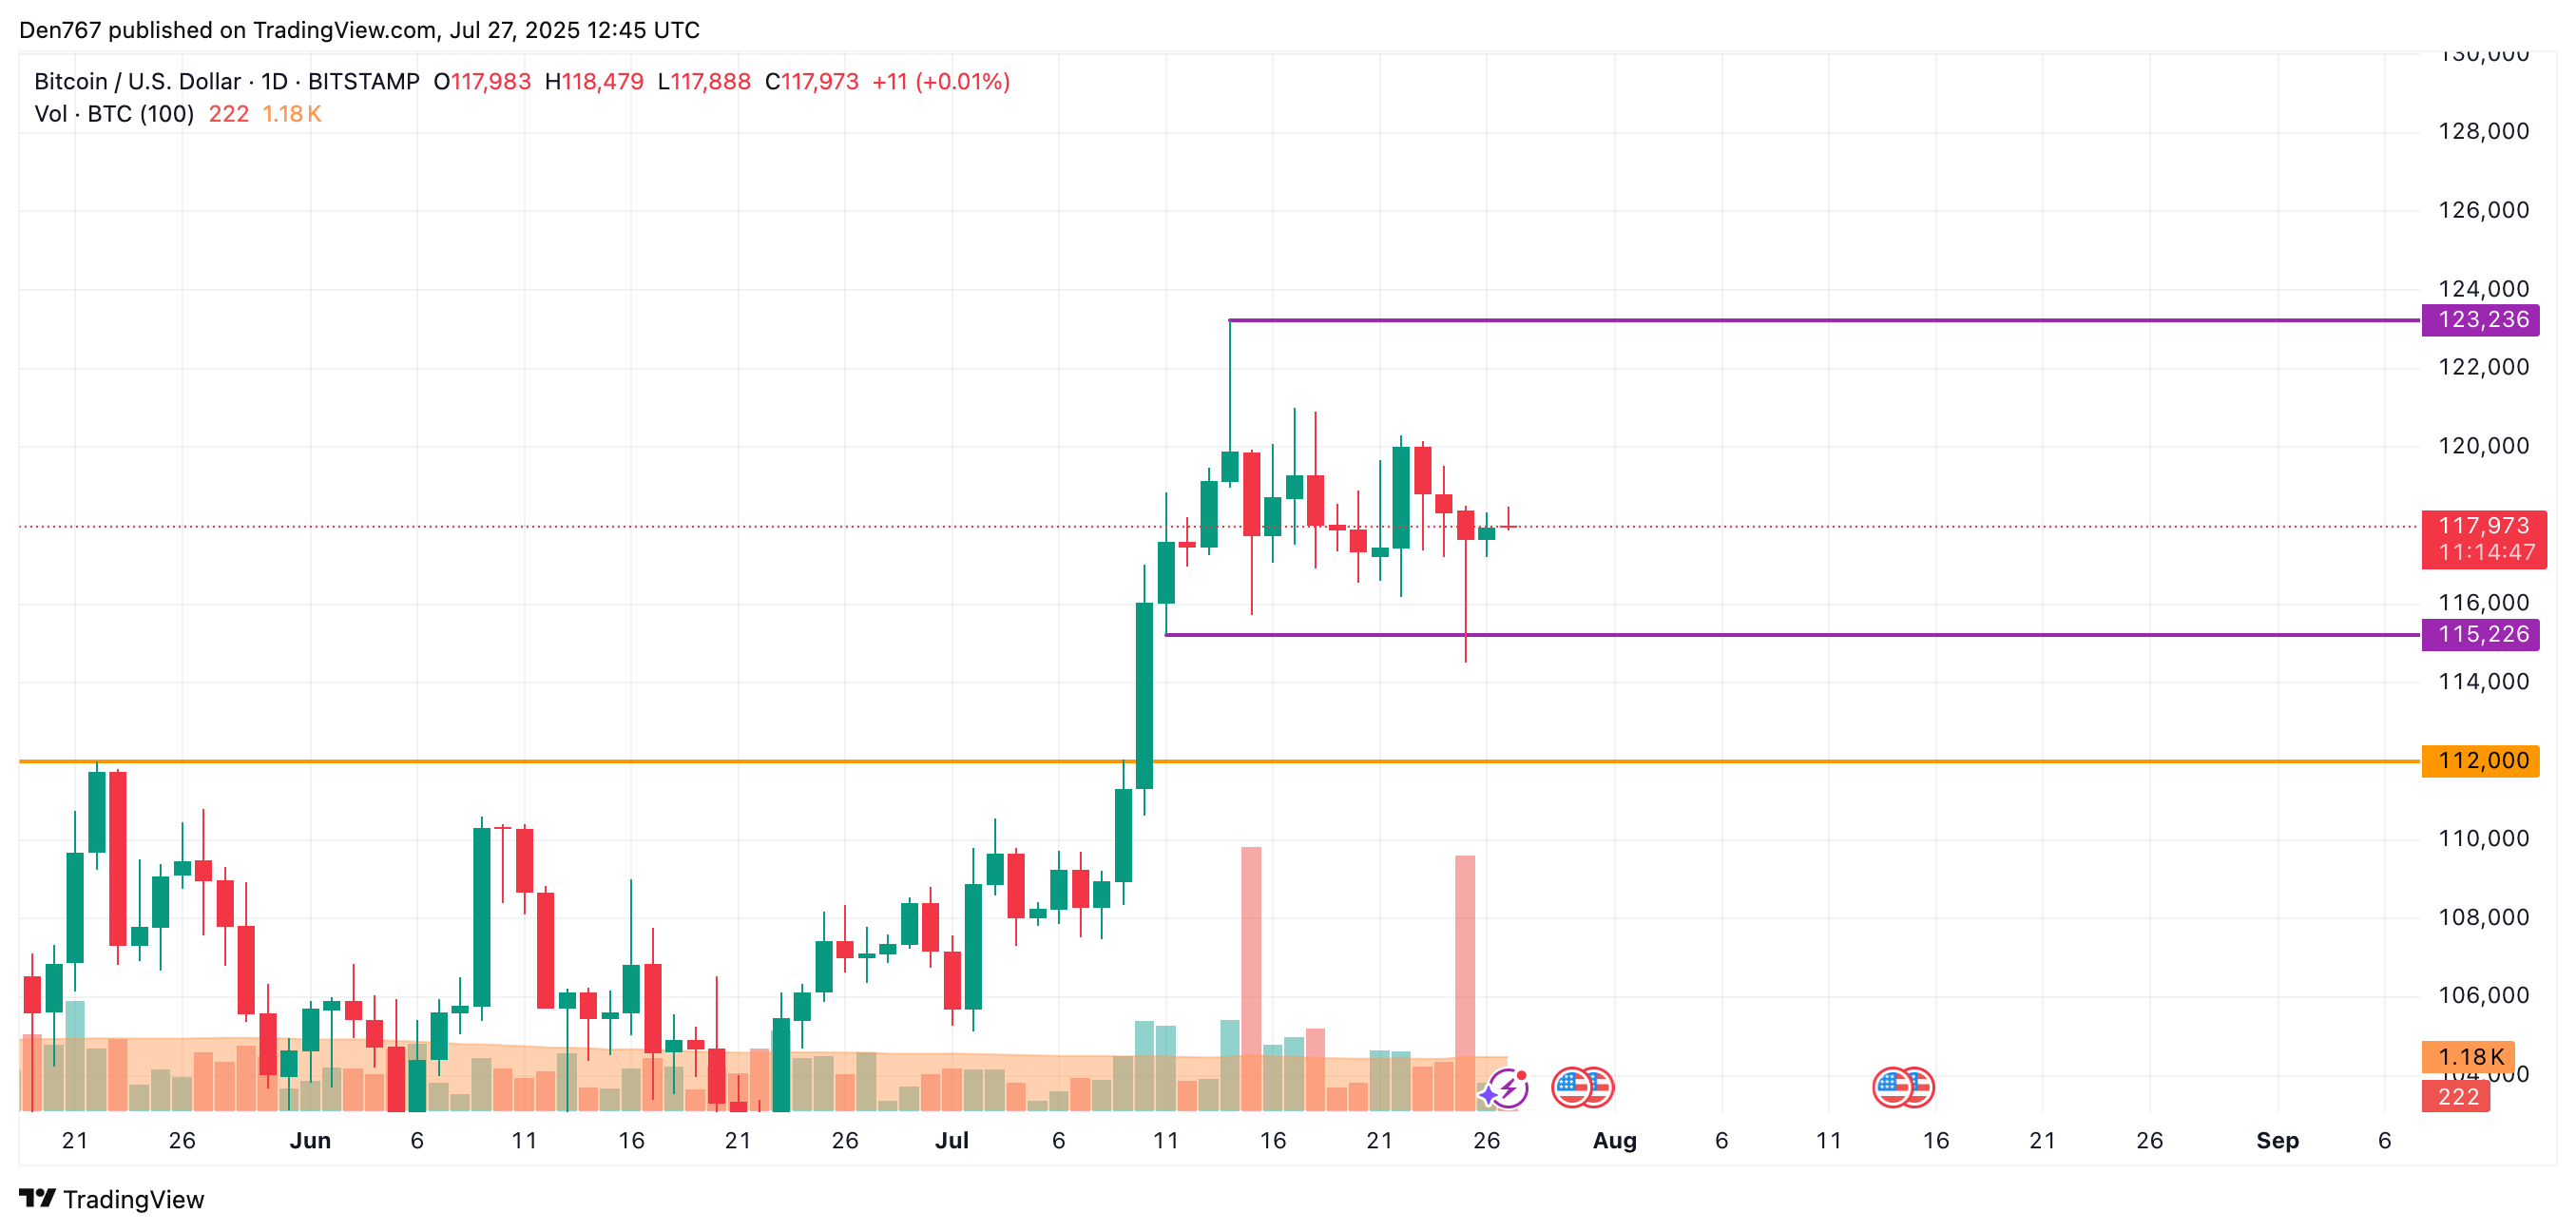
On the bigger time frame, neither side is dominating as the rate of BTC is far from the key levels.
In this case, ongoing sideways trading in the area of $116,000-$119,000 is the more likely scenario over the next few days.
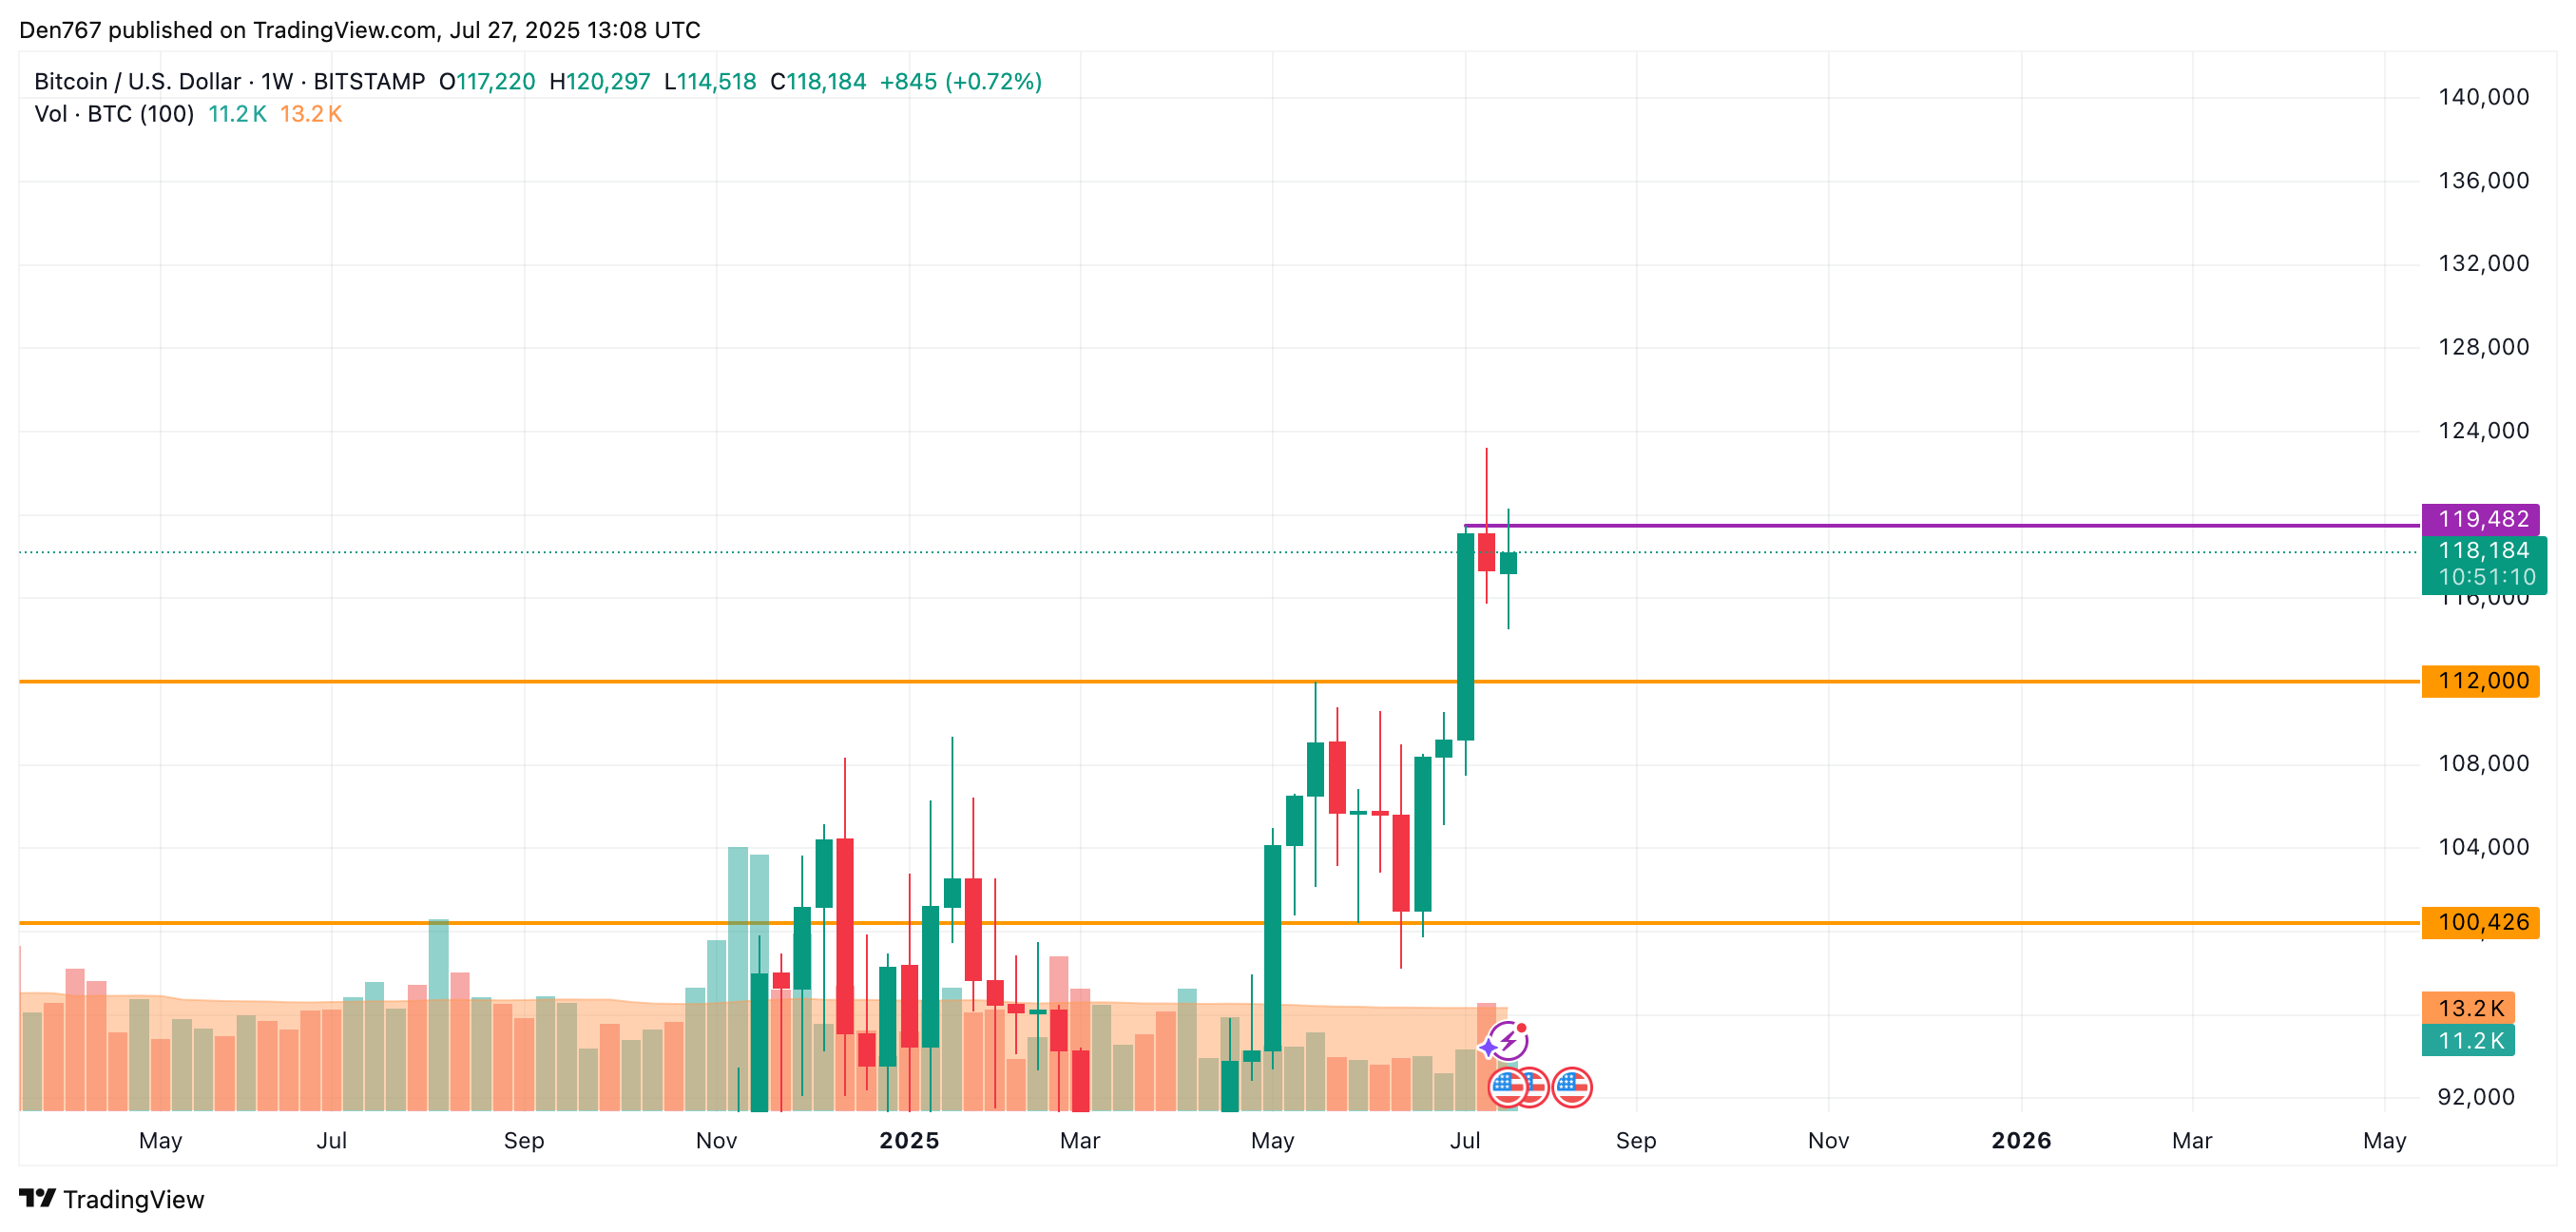
From the midterm point of view, traders should pay attention to the weekly candle closure in terms of the $119,482 level. If it happens far from that mark, there is a possibility of a drop to the $112,000 mark.
Bitcoin is trading at $118,184 at press time.