
Bitcoin price was stuck in a tight range this week as the forming pennant pattern and the Crypto Fear and Greed Index point to a rebound.
- Bitcoin price has formed a bullish pennant pattern on the daily chart.
- The Crypto Fear and Greed Index remains in the gear zone.
- Technicals point to an eventual Bitcoin price surge.
Bitcoin (BTC) has remained inside a narrow range since July 14 when it pulled back after hitting its all-time high of $123,200.
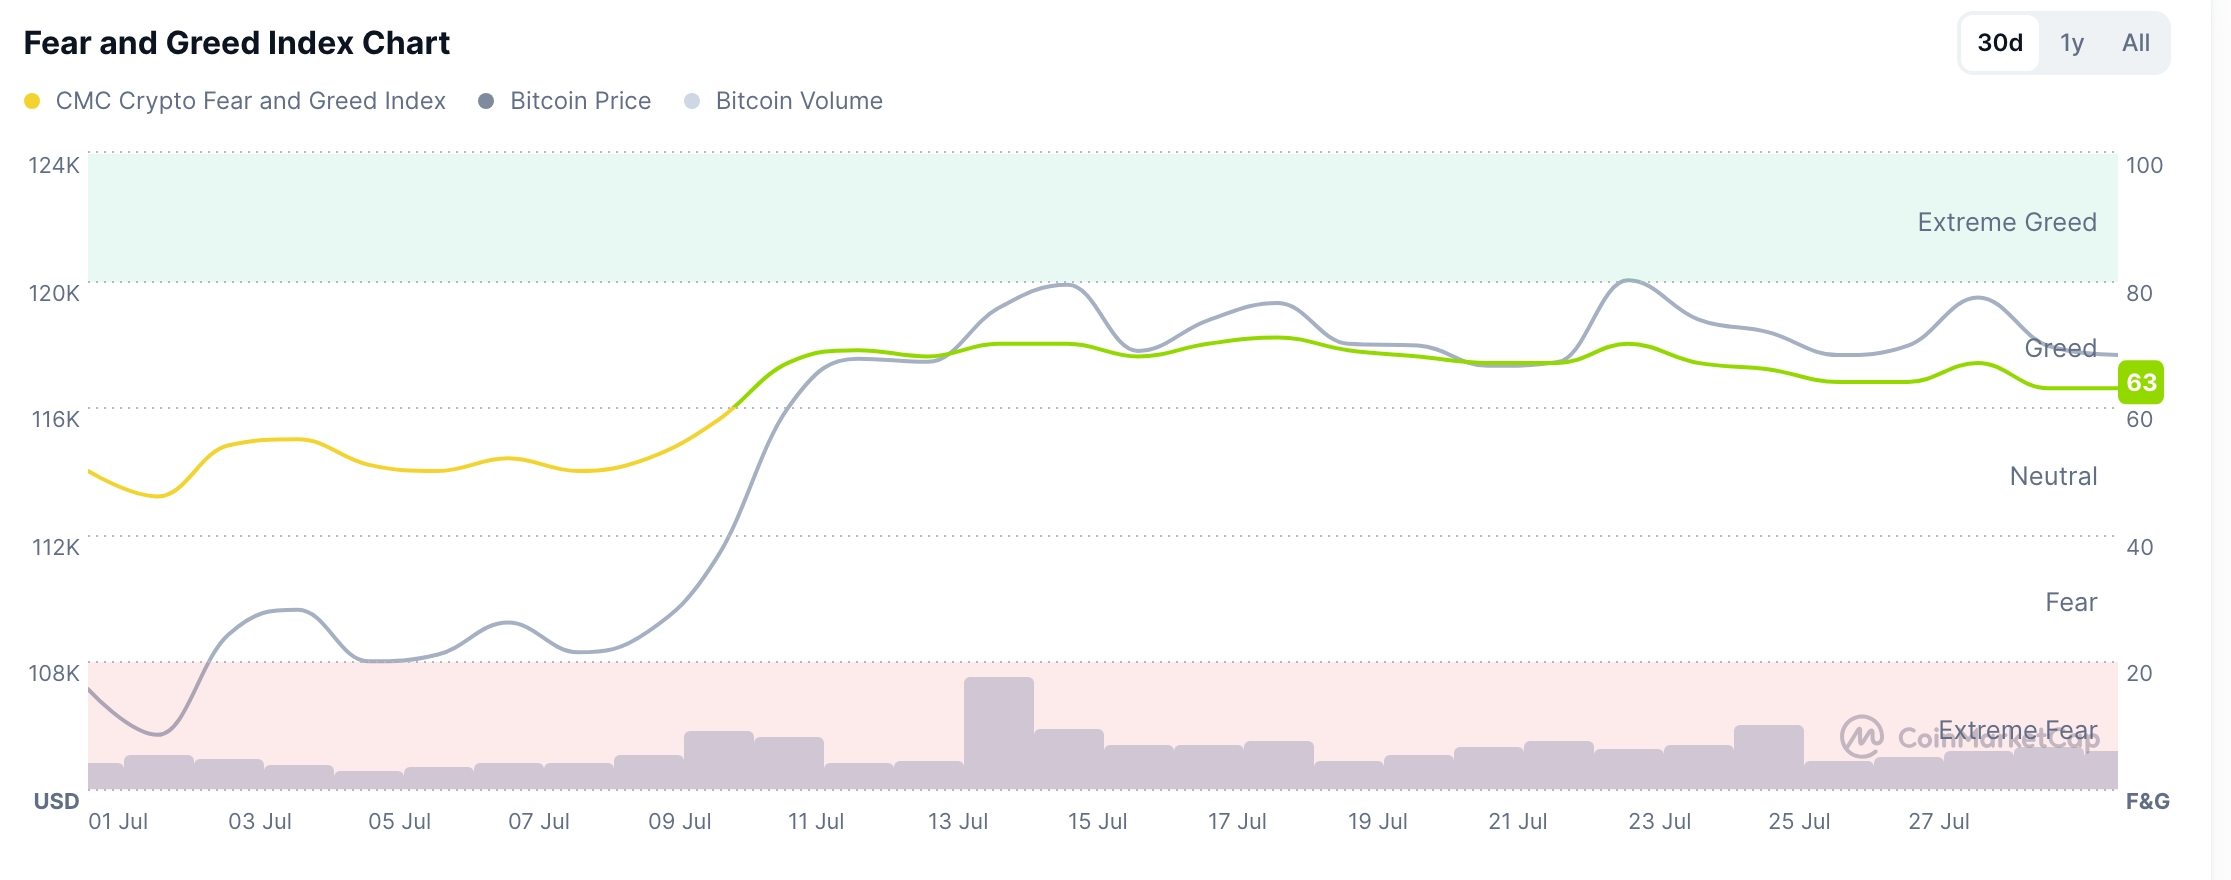
Crypto Fear and Greed Index is at 63
A closely watched gauge shows that crypto investors are still greedy despite the ongoing pullback in the altcoin market. The Crypto Fear and Greed Index has remained at the greed zone of 63, down from the year-to-date high of 71.
This index is inspired by a similar one introduced by CNN Money. It examines five key indicators to gauge market sentiment in the cryptocurrency industry. For example, it looks at the price momentum of the top ten coins excluding stablecoins and how they are performing.
The other metrics are Bitcoin’s and Ethereum’s volatility, the derivative market, and market composition. It then uses CoinMarketCap’s proprietary data to assess social media sentiment. In most cases, cryptocurrencies do well when there is greed in the market.
CNN Money’s Fear and Greed Index has also remained in the green zone of 68. This greed is driven by stock price strength, stock price breadth, and put-and-call options, which are at the extreme greed zone.
The two fear and greed gauges indicate an eventual Bitcoin price rebound, potentially following the Federal Reserve’s interest rate decision. The bullish case is also based on the ongoing accumulation by institutional investors as ETF inflows continue.
Bitcoin price technical analysis
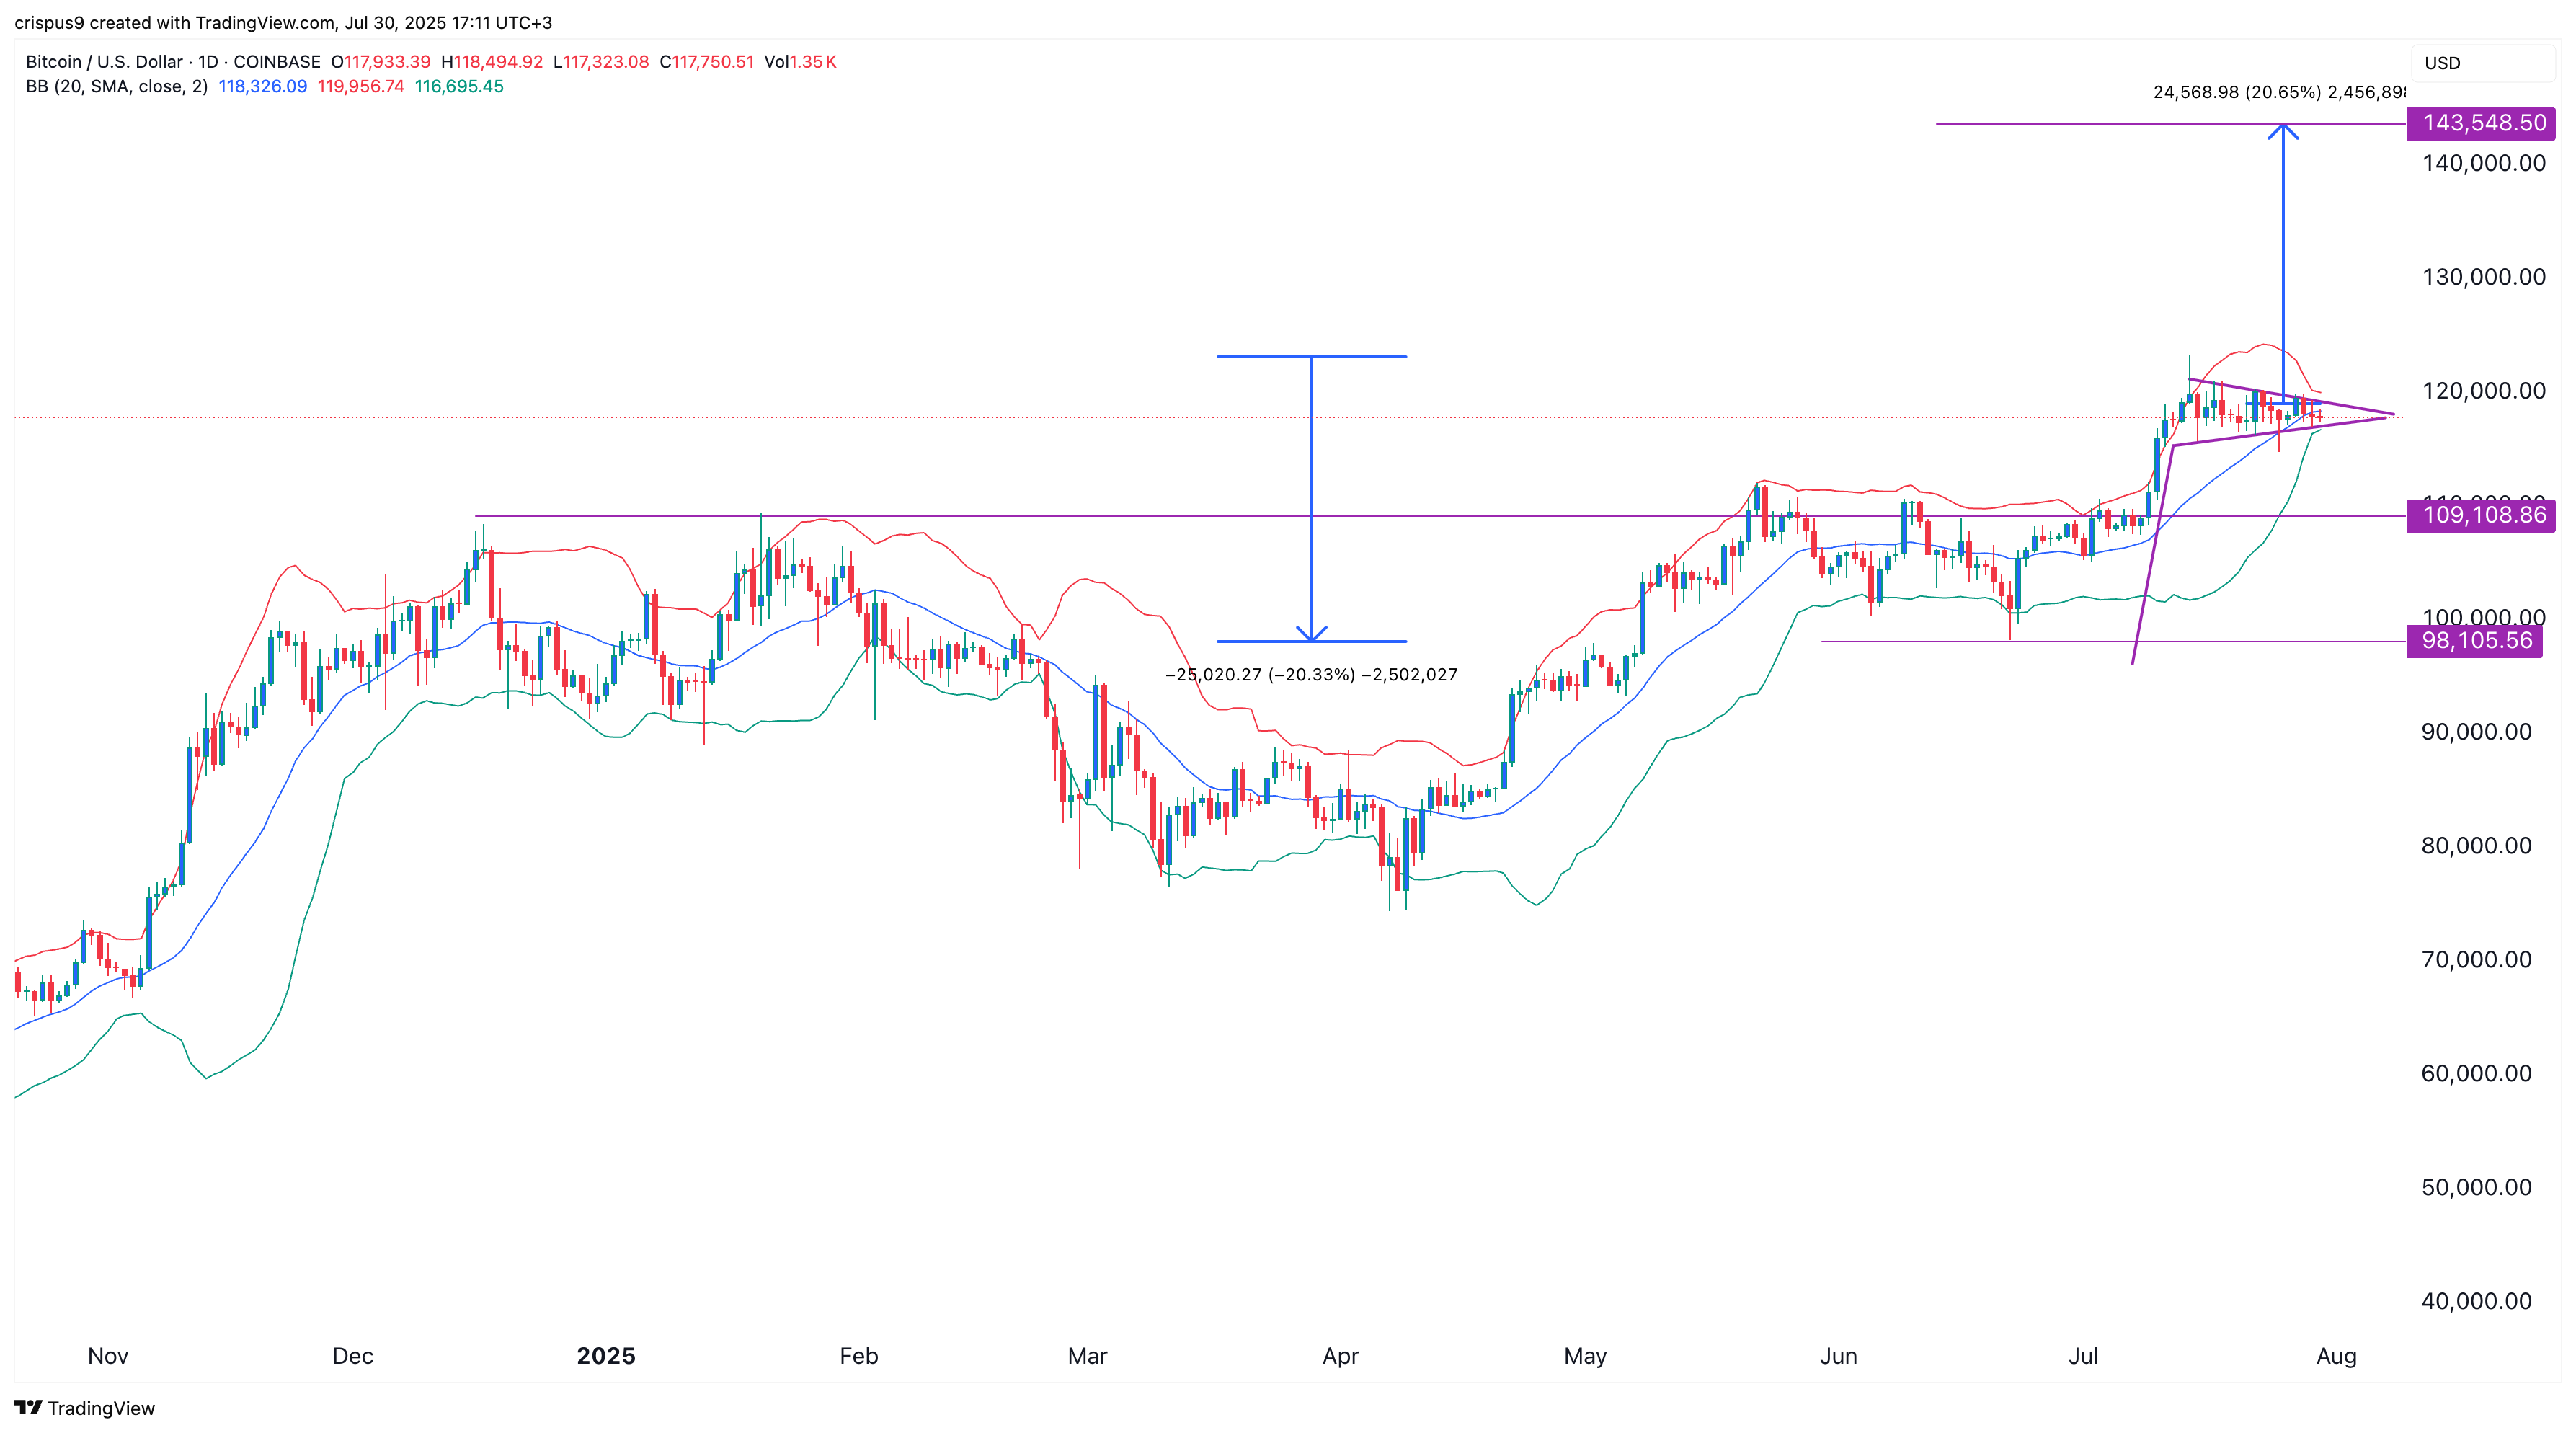
Technical analysis shows that Bitcoin price remains in a tight range this week. As a result, the three lines of the Bollinger Bands have narrowed, a sign that volatility has dried up. In most cases, this performance typically results in a squeeze in either direction.
There is a chance that the squeeze will be to the upside as the coin has formed a bullish pennant pattern. This pattern comprises a vertical line resembling a flagpole and a symmetrical triangle.
The flagpole in this pattern is about 20%. Measuring the same distance from the potential breakout point signals a surge to $143,550.