
The middle of the week is dominated by sellers, according to CoinStats.
BTC/USD
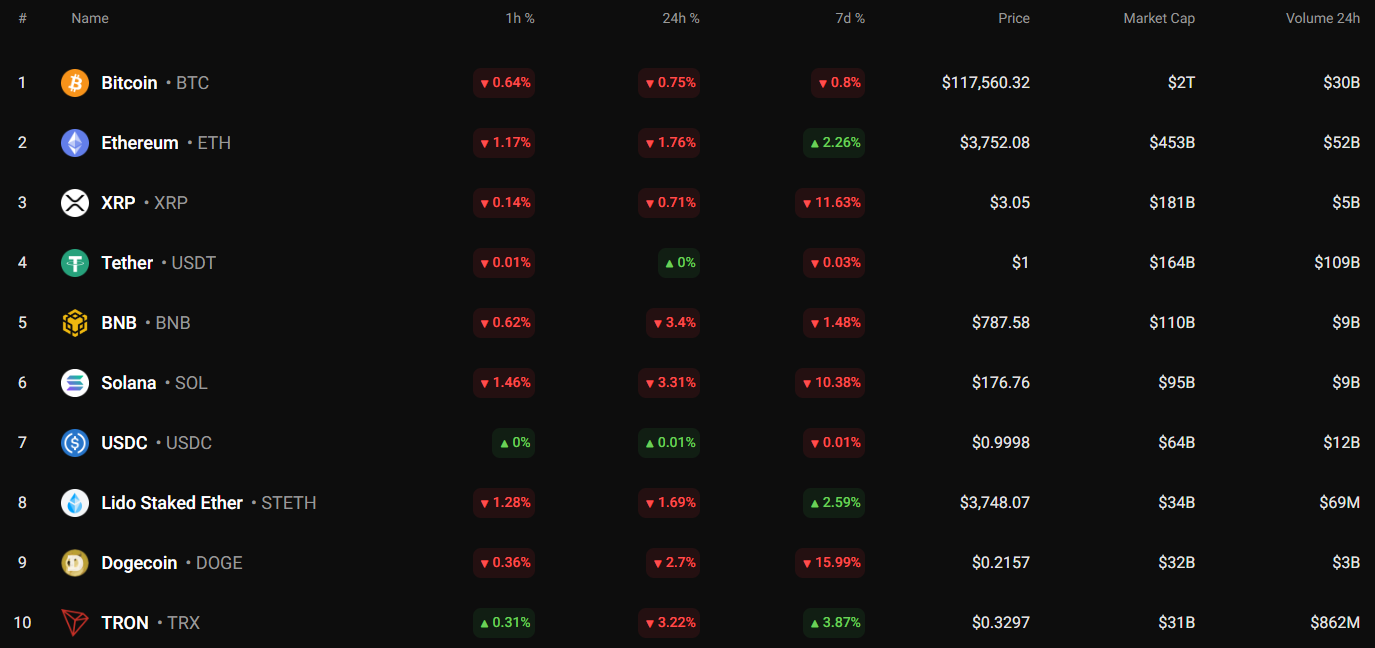
The price of Bitcoin (BTC) has gone down by 0.75% over the last day.
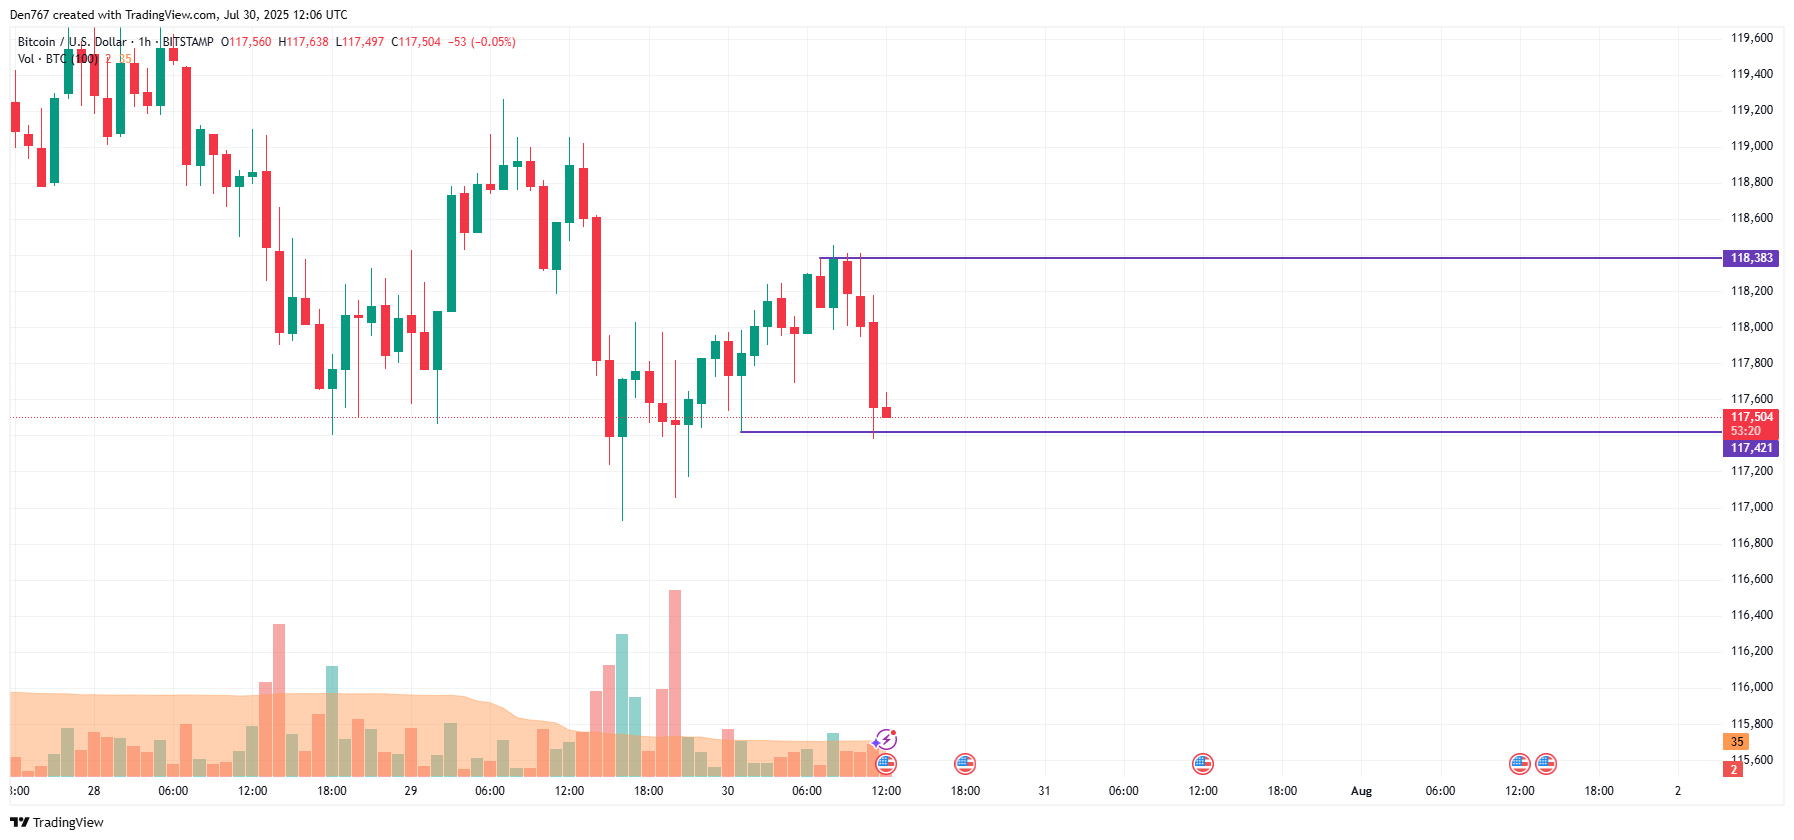
On the hourly chart, the rate of BTC is about to break the local support of $117,421. If it happens, the ongoing drop may lead to a test of the $117,000 mark shortly.

On the longer time frame, the price of the main crypto is far from the support and resistance level. However, if the daily bar closes below the $117,000 zone, there is a high possibility of a continued decline to the $115,000-$116,000 range.

From the midterm point of view, buyers have failed to keep rising after the previous bullish closure.
If nothing changes by the end of the week, traders can expect a test of the $112,000 support soon.
Bitcoin is trading at $117,474 at press time.