Bitcoin has entered a highly sensitive phase after an aggressive downside continuation. The recent sell-off has pushed it into a historically reactive demand region of $60K, while broader risk sentiment remains fragile. The market is approaching a juncture where technical structure, higher-timeframe demand, and on-chain liquidity dynamics converge, making the coming sessions critical for short- to mid-term direction.
Bitcoin Price Analysis: The Daily Chart
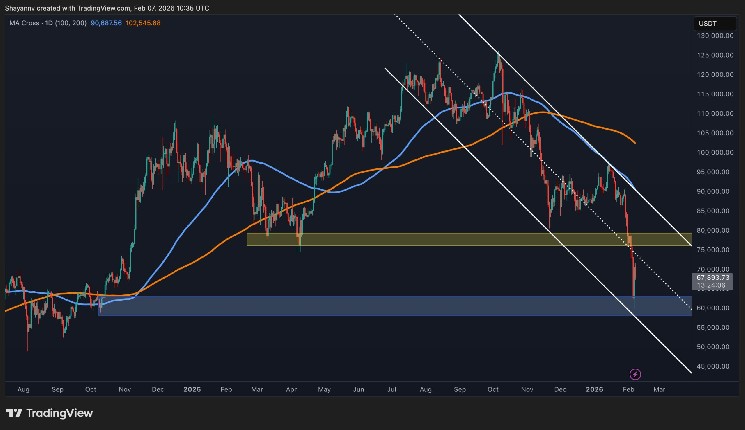
On the daily timeframe, Bitcoin has decisively broken below its recent structure and continued to respect the descending channel, while the rejection from the middle boundary of $75K confirms that sellers remain firmly in control. The most important development is the impulsive breakdown toward the lower boundary of the channel, where the asset is now testing a major demand zone at the $60K price region that previously acted as a strong buyers’ base earlier in the cycle.
This demand area, located at the $60K region, is structurally significant as it represents the last major consolidation before the previous impulsive expansion. While prior price action on the chart confirms this zone’s historical relevance, the current interaction is far more aggressive, suggesting that any bullish reaction from this region would likely begin as a corrective bounce rather than an immediate trend reversal.
As long as Bitcoin remains below the descending channel resistance and the 100- and 200-day moving averages, the daily structure remains decisively bearish, with downside continuation still a valid risk if demand fails to absorb selling pressure.
$BTC/$USDT 4-Hour Chart
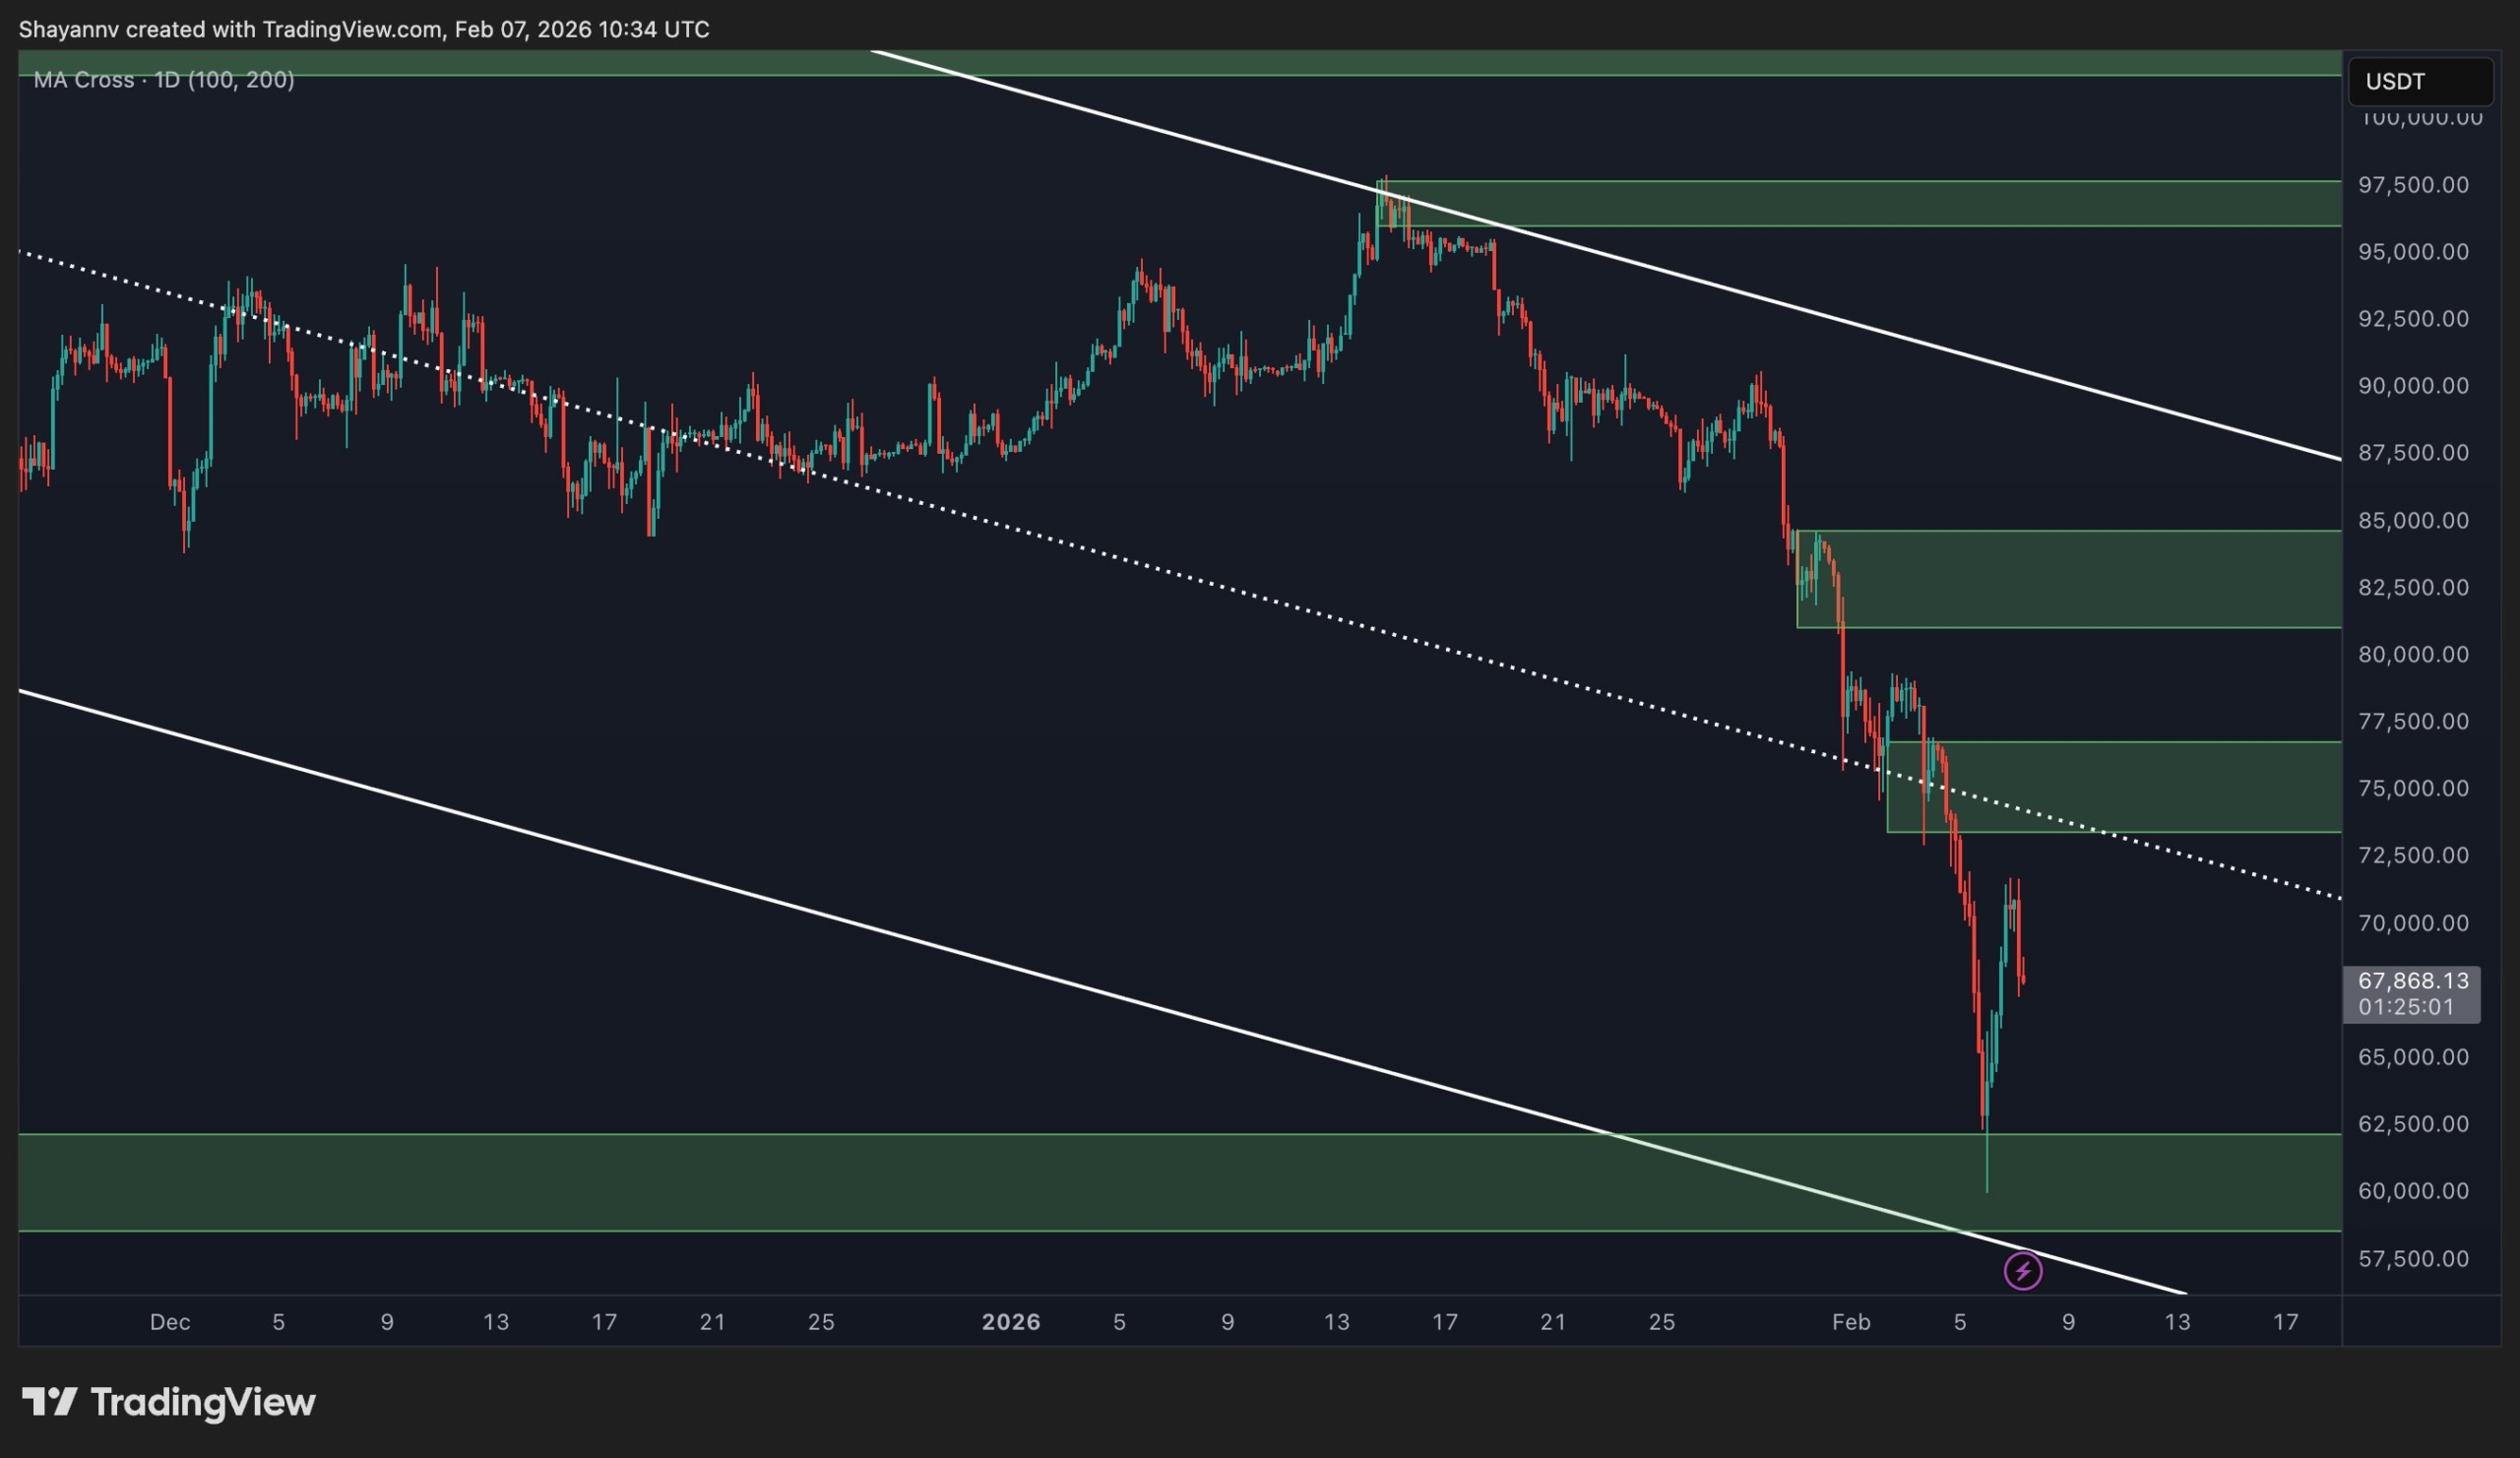
Zooming into the 4-hour timeframe, the bearish structure becomes even clearer. The most recent move shows a sharp sell-side expansion into the current demand zone at $60K psychological support, followed by a minor reactive bounce, which so far lacks strong follow-through.
From a short-term perspective, the key level to monitor is the nearest supply zone overhead at the $75K, formed after the last impulsive breakdown. Any corrective rebound is likely to face selling pressure as the price approaches this area, especially if volume and momentum remain weak.
As long as Bitcoin fails to reclaim and hold above this supply region, rebounds should be treated as pullbacks within a broader bearish trend rather than confirmation of a trend shift. A failure to hold the current demand zone would expose the price to a deeper downside extension toward the channel’s lower boundary of $55K.
Sentiment Analysis
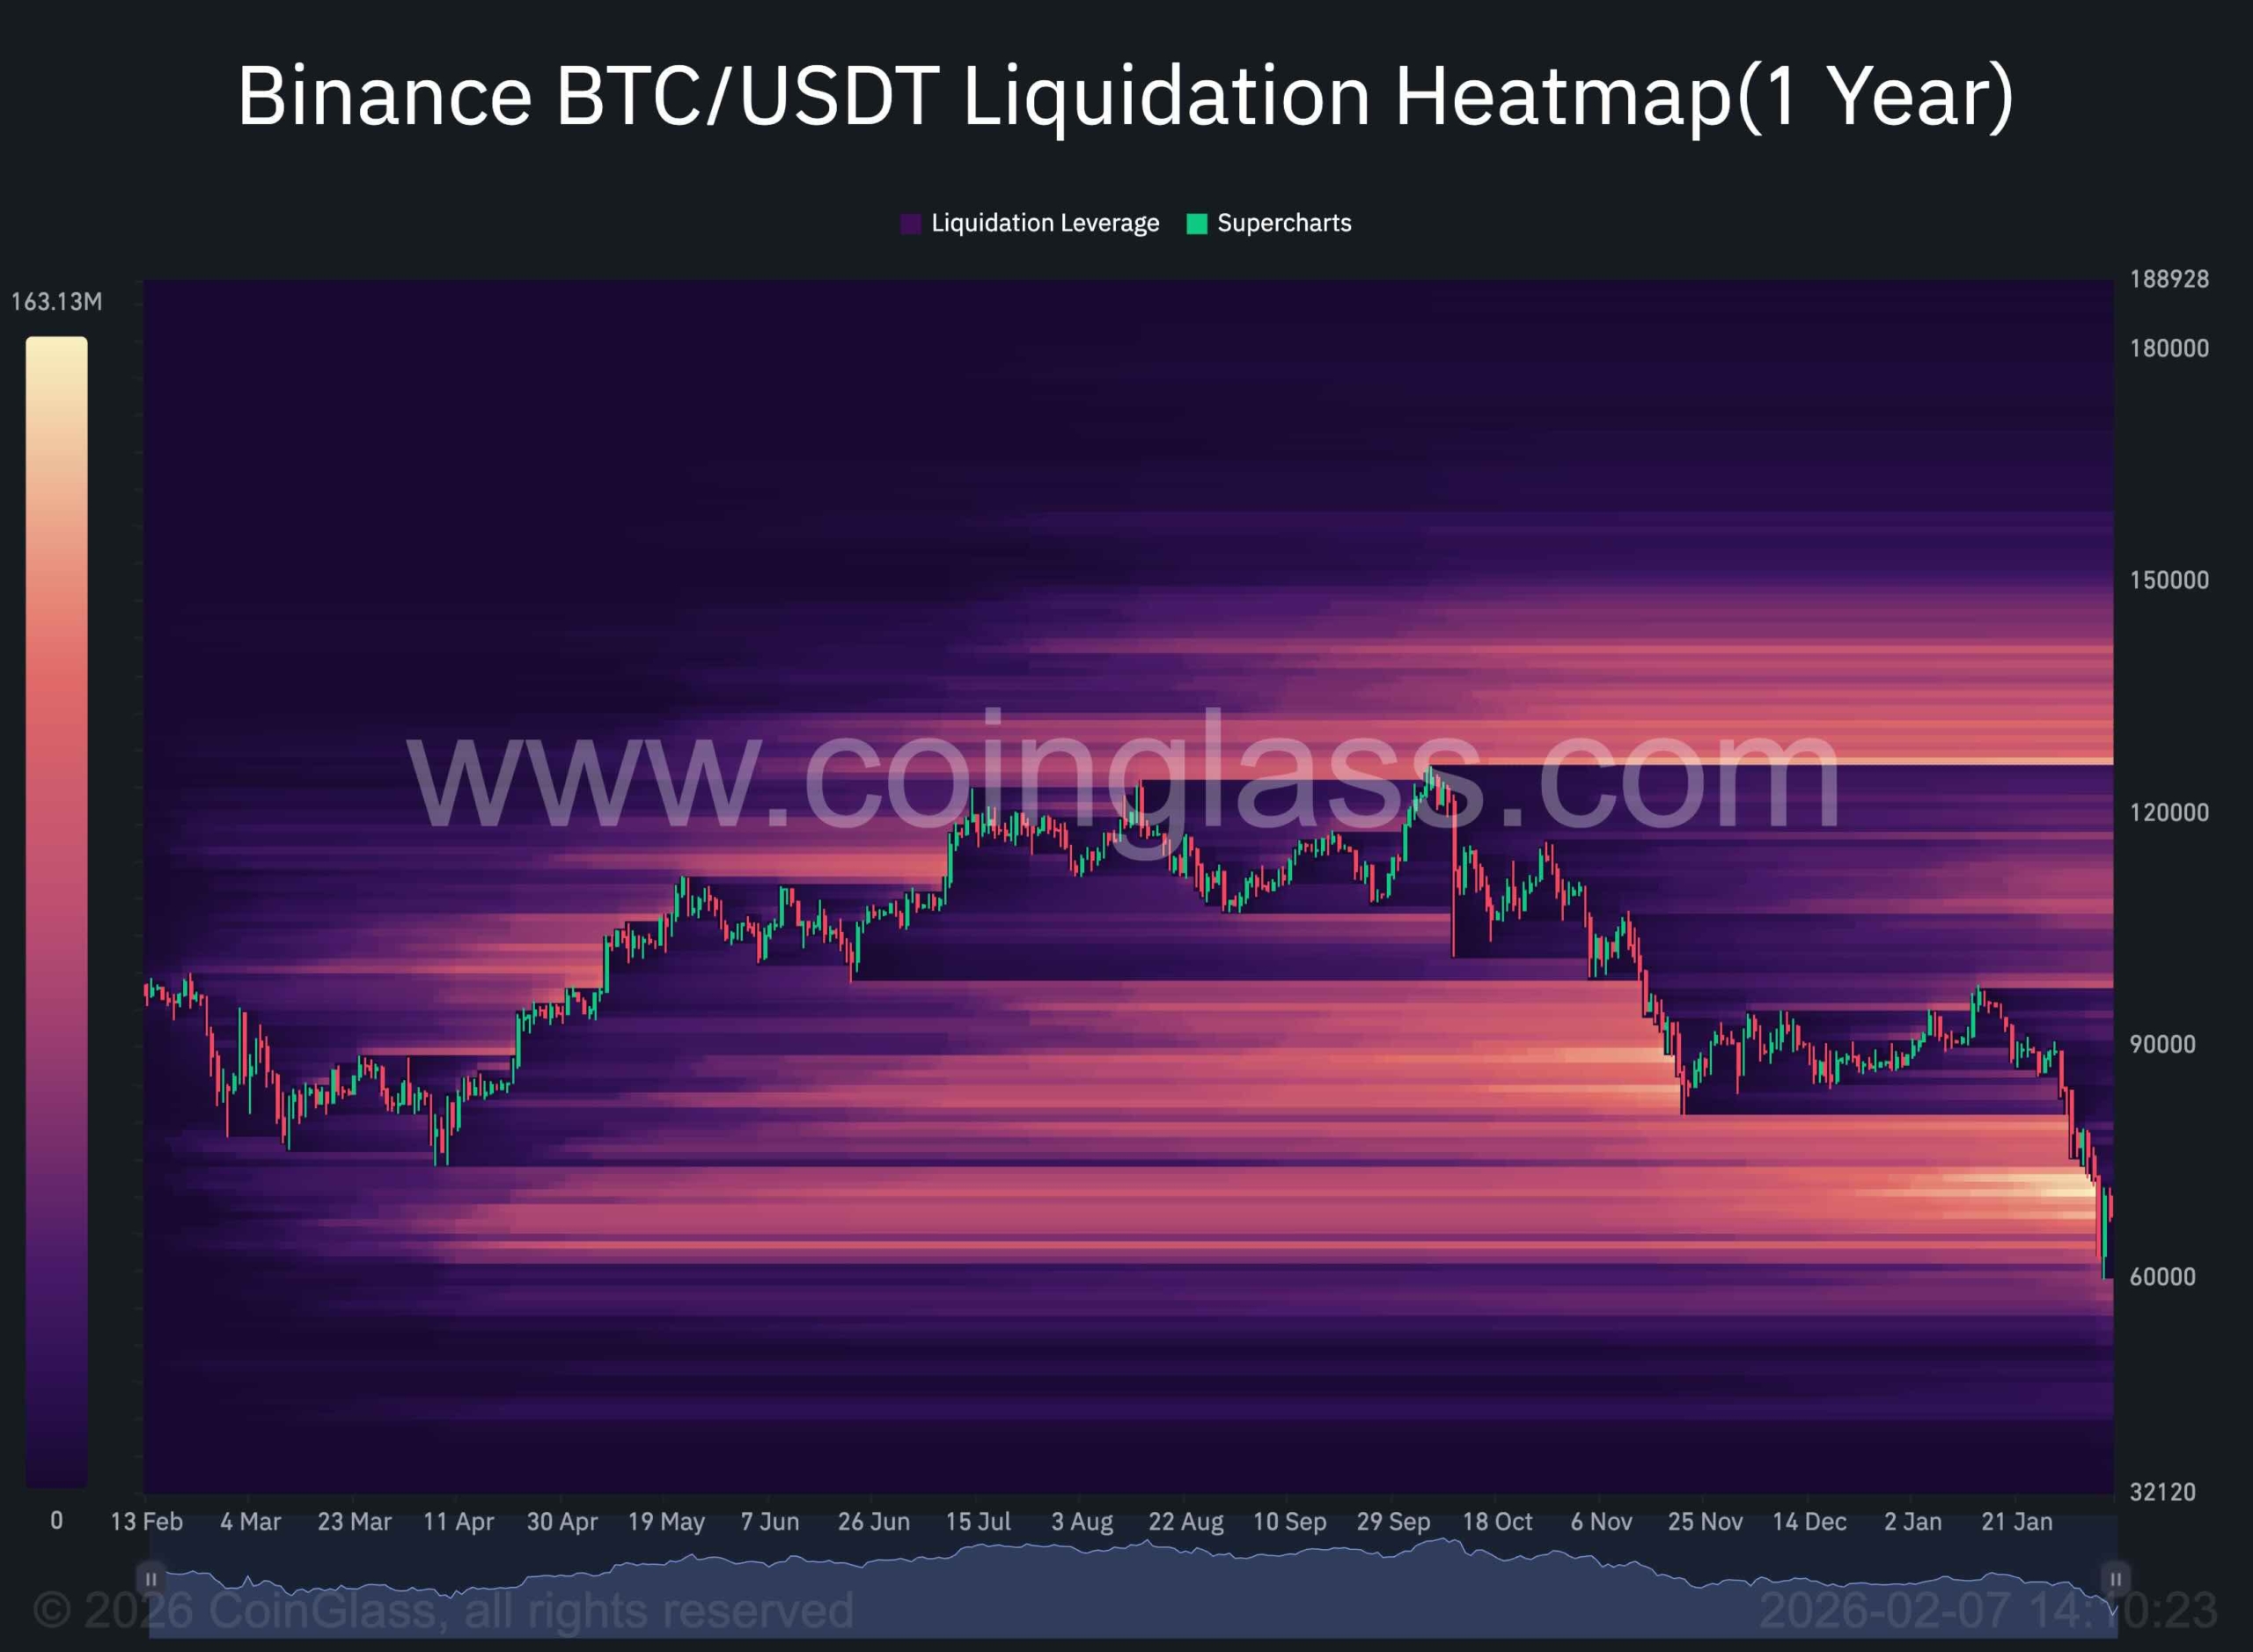
The liquidation heatmap provides valuable context for the recent price behavior. The one-year $BTC/$USDT liquidation heatmap shows a dense liquidity pocket concentrated around and slightly below the $60K–$65K region, which aligns closely with the current price area. This clustering of liquidity suggests that this zone has been a magnet for price, driven by forced liquidations of over-leveraged long positions during the recent sell-off.
Notably, as price approaches this region, liquidation intensity declines relative to current levels, indicating that a substantial portion of downside leverage has already been unwound. This dynamic increases the probability of short-term stabilization or a reactive bounce, particularly if aggressive sellers begin to lose momentum.
However, the absence of significant liquidation clusters above current price levels implies that upside liquidity is limited in the short term, reinforcing the idea that any rebound is more likely to be corrective rather than trend-changing.
Overall, while the broader structure remains bearish, the convergence of strong historical demand and reduced downside liquidation pressure suggests that Bitcoin may attempt a relief move or consolidation phase from this zone.