Bitcoin broke out of a descending price channel on the one-hour $BTC/$USDT chart, according to an analysis shared by X user CryptoJack. The chart shows price moving above the upper trendline of a downward-sloping channel that had guided lower highs since mid-February. At the time of the post, $BTC traded near the upper $67,000 area, after rebounding from lows around the mid-$66,000s.
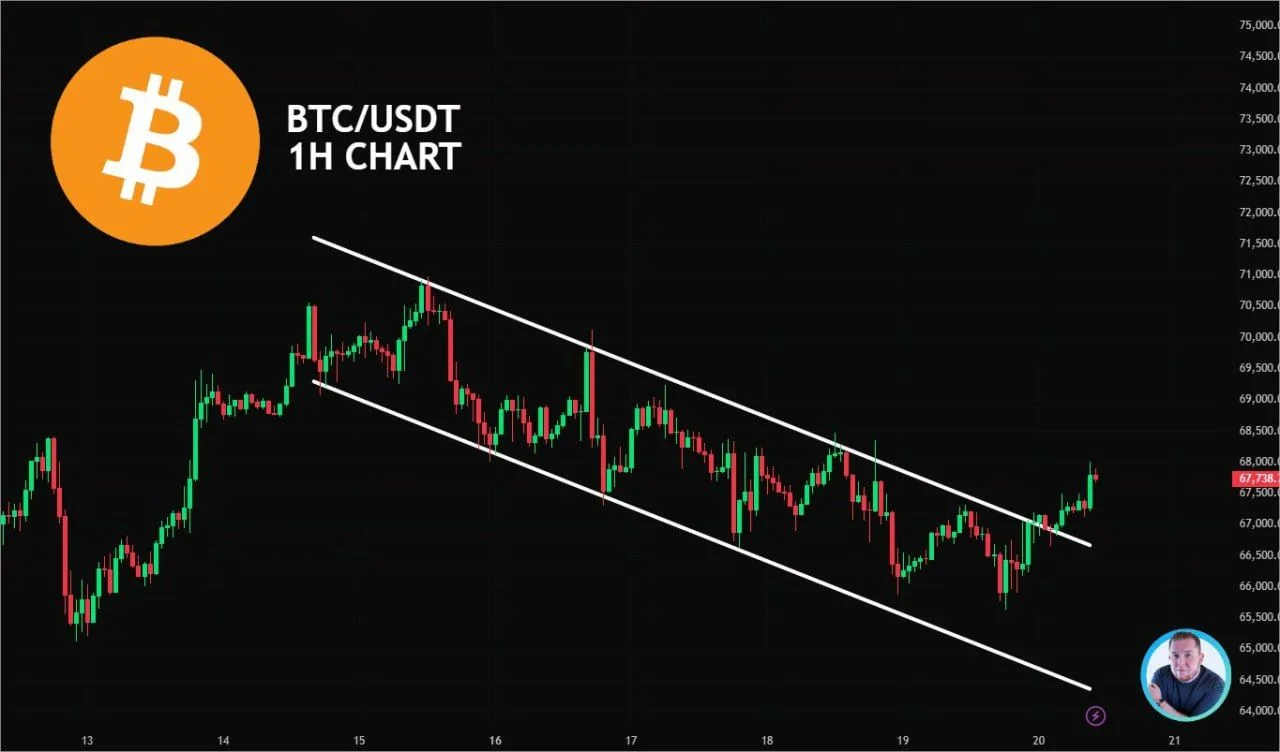
Bitcoin Descending Channel Breakout. Source: CryptoJack
The breakout followed several sessions of compressed trading within the channel. Earlier, price failed multiple times near the upper boundary, while each pullback found bids near the lower trendline. As a result, the structure formed a clear descending channel with defined resistance and support. The move above the channel marked the first sustained push beyond that resistance on the one-hour timeframe.
However, the breakout occurred after a series of lower highs and lower lows on intraday charts. Therefore, short-term trend context remains mixed until price holds above the former channel top. In addition, nearby resistance sits just above the breakout area, based on recent swing highs on the same timeframe.
Bitcoin Macro Cycle Pattern on Monthly Chart
Bitcoin’s long-term price action follows repeating macro cycles on the monthly $BTC/$USDT chart from Binance, based on an analysis shared by X user 0xbeehive. The chart segments price into multi-year bullish and bearish phases, with green zones marking extended uptrends and red zones marking shorter downtrends. Each bullish phase spans about 1,066 days, while each bearish phase spans about 365 days, according to the labels shown on the chart.
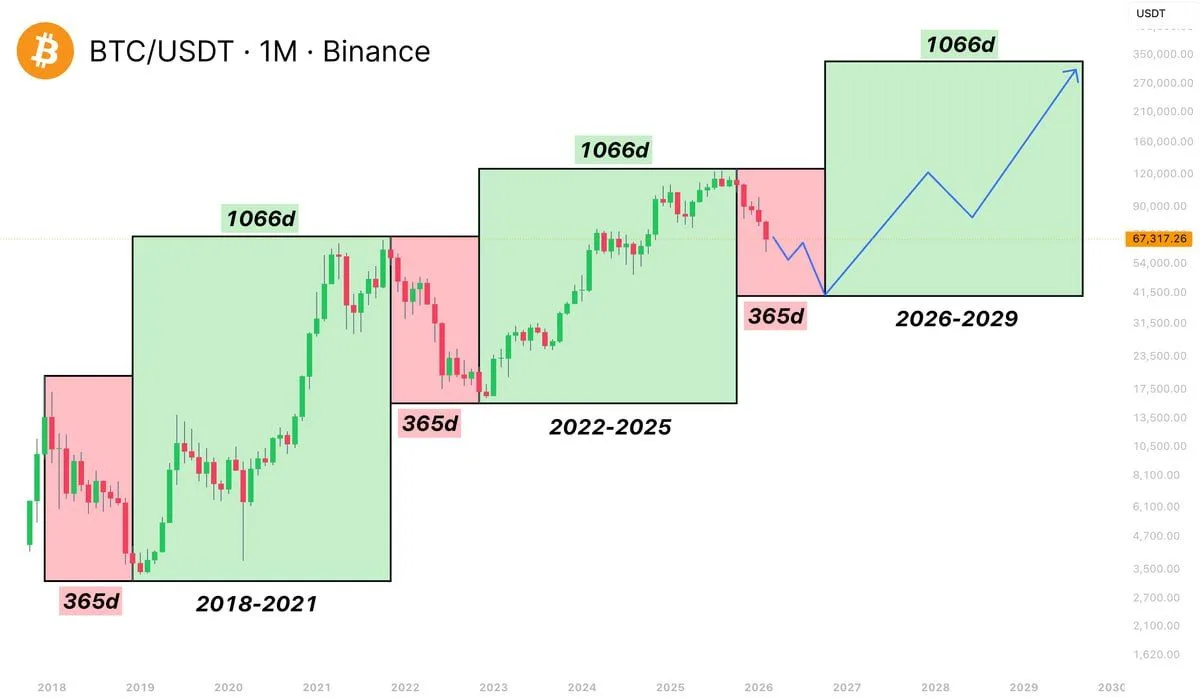
Bitcoin Macro Cycle Timeline (BTCUSDT Monthly). Source: bee (0xbeehive)
The first cycle marked on the chart shows a bullish phase from 2018 to 2021, followed by a bearish phase from 2021 to 2022. The next cycle shows another extended advance from 2022 to 2025, then a projected bearish phase from 2025 to 2026. The final segment projects another multi-year advance from 2026 to 2029, with a rising path drawn inside the green box to illustrate the expected structure of higher highs and higher lows.
However, the chart presents the pattern as a historical repetition based on prior cycles. As a result, the projection for 2026 to 2029 reflects a modeled path rather than observed price data. The current price marker sits near the mid-$67,000 area on the monthly view, placing Bitcoin near the end of the 2022 to 2025 green zone and ahead of the projected transition into the next red zone on the chart.