Bitcoin breaches key Fibonacci level signaling a stronger downtrend with RSI near oversold, yet an analyst sees bullish setup.
Bitcoin ($BTC) is trading at $64,796.37, marking a sharp 4.7% decline over the past 24 hours. This drop positions the crypto within a 24-hour range of $64,435.13 to $68,211.66, highlighting increased short-term volatility.
Performance indicators reveal a consistent downtrend: a minor 0.2% slip in the last hour, escalating to 5.2% over seven days, 8.2% in two weeks, a steeper 27.7% drop over 30 days, and a concerning 32.8% loss year-over-year.
The treasury holdings of 1,760,272 $BTC add an intriguing layer, suggesting institutional involvement that could either stabilize or exacerbate swings. As Bitcoin teeters at the lower end of its range, one can’t help but wonder: is this the ultimate buying opportunity for the bold, or the harbinger of a deeper bear market that reshapes the crypto landscape?
Bitcoin Price Analysis
On a technical viewpoint, Bitcoin is currently showing clear signs of weakness on this daily chart. Traders are closely watching the Auto Fibonacci Retracement levels drawn from a recent high near $70,943 down to a low around $59,998.
These levels act as potential support and resistance during pullbacks. Bitcoin has already tested and breached the important 0.5 Fibonacci level at approximately $65,460, a break that often indicates the downtrend is strengthening rather than pausing for a simple correction.
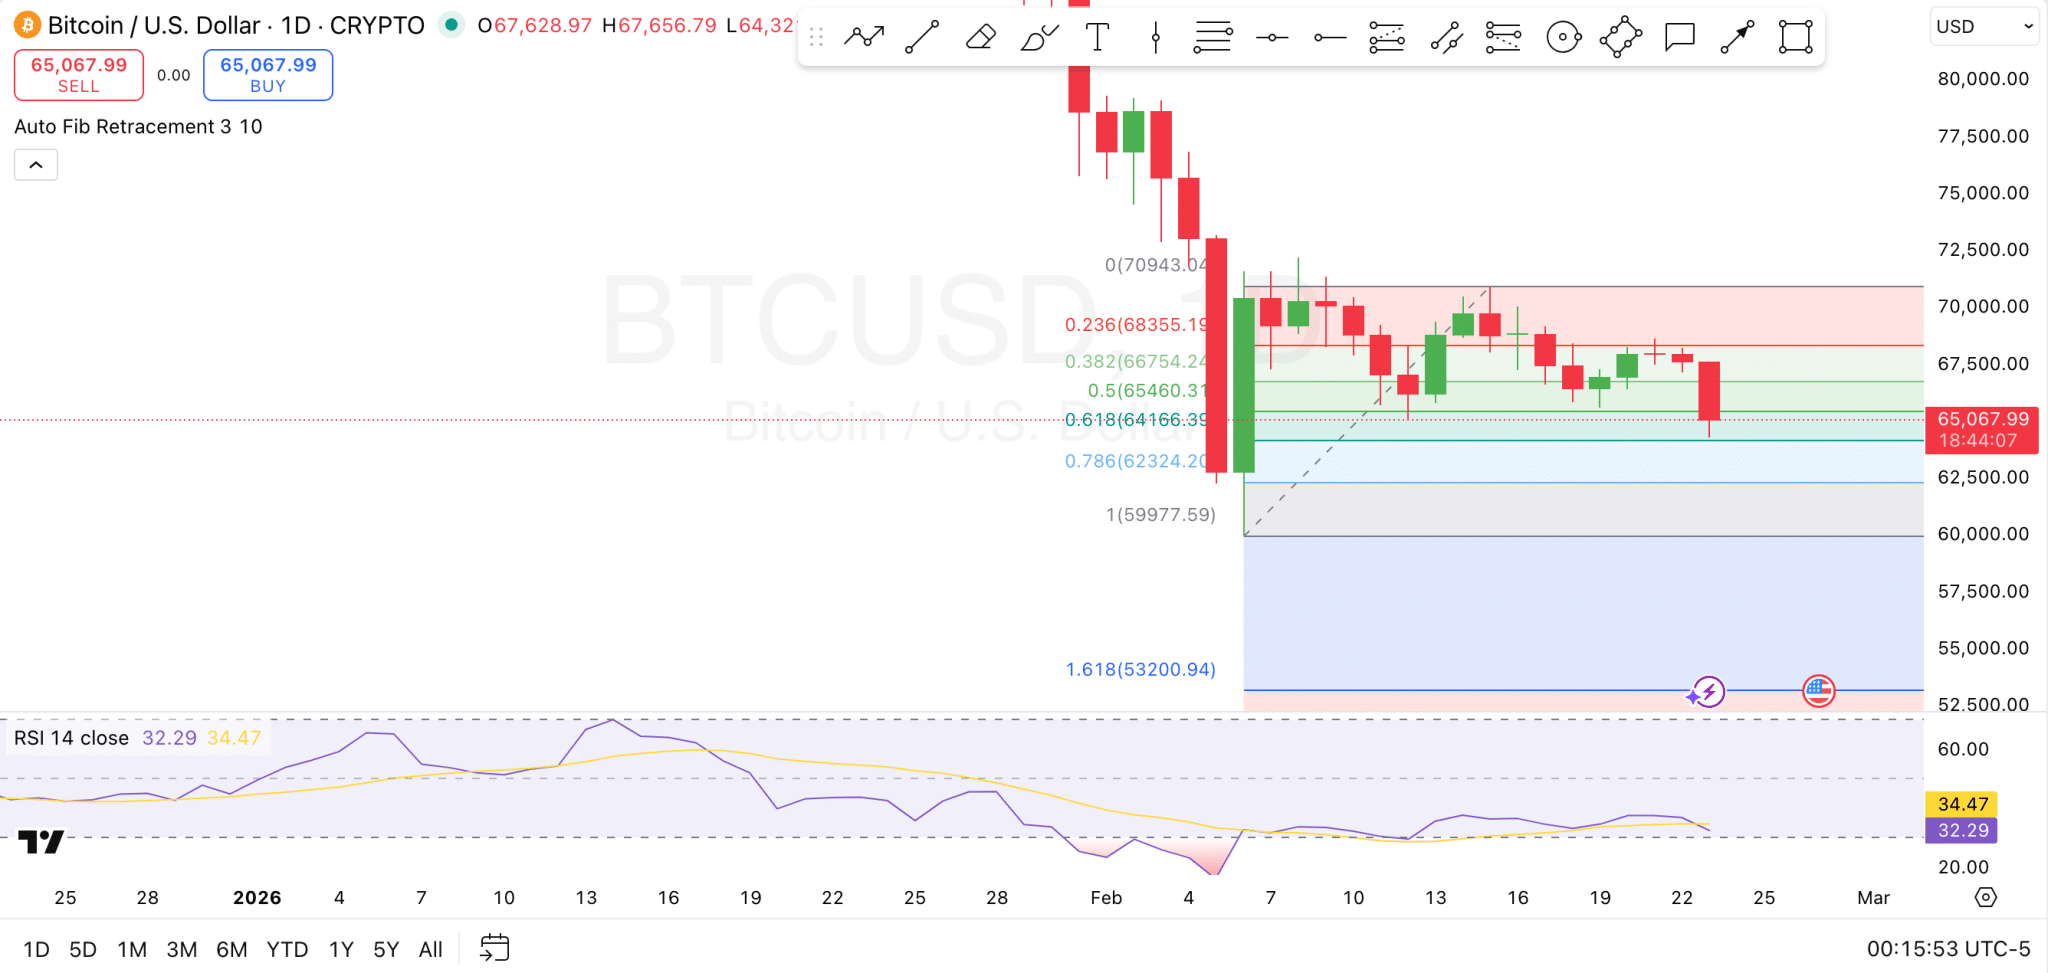
The price is now hovering just above the deeper 0.618 level around $64,166. If selling pressure continues without a strong reversal, the next major areas of interest could be $62,300 or even the extended 1 level near $59,977 in a more severe scenario.
On the upside, reclaiming the 0.5 level around $65,460 would require significant buying power to signal any meaningful recovery. The Relative Strength Index on the 14-period setting is currently reading 32.29, with the signal line around 34.47.
This places the RSI very close to oversold region. While the indicator shows persistent weakness, it has not yet reached extreme oversold levels, meaning downside risk remains present but a relief rally could develop if buyers step in aggressively at these lower prices.
Where’s Bitcoin Headed?
Elsewhere, analyst SuperBro described Bitcoin’s current daily chart setup as a “beautiful bullish” formation in his February 23 analysis. He argued that the price action has strategically cleared out lower liquidity by wiping out most leveraged longs below while deliberately leaving overhead shorts untouched to serve as potential fuel for a later squeeze.

Although he acknowledged that the pattern could technically be interpreted as a bear pennant breakdown targeting below $50K, he views such a deep move as overly ambitious for the bears given that it would land directly into a major multi-year support zone, making it unlikely to materialize.
SuperBro emphasized that this remains a setup rather than a certainty, but if Bitcoin holds its current lows on a closing basis, the path will open for a strong rally back into the $70,000 region and potentially higher.