Bitcoin tests key Fibonacci resistance as geopolitical tensions rise, while weekly EMAs break fuels debate over trend direction.
Bitcoin ($BTC) is hovering near $66,149, down 1.0% in the past 24 hours, as the price fluctuates between $65,149 and $67,263. Attempts to hold above $67,000 have faded, leaving $BTC in a tight, choppy range. While the asset remains up 2.3% over the past week, it is still down 20.9% over 30 days and 22.6% year-over-year, underscoring the broader corrective trend.
These price movements have unfolded amid heightened geopolitical tension following reports of escalation between the U.S., Israel, and Iran, including reports of Iran’s supreme leader’s assassination. In this environment, Bitcoin appears caught between its role as a risk asset and a potential hedge, with $65,000 acting as near-term support and $67,000–$68,000 serving as immediate resistance.
Bitcoin Price Analysis
Looking at a 1D technical chart, Bitcoin is consolidating within its Fibonacci retracement structure after rebounding from the recent low near $64,166. Price is currently hovering above the 0.5 Fib level ($65,460) and pressing against the 0.382 resistance at $66,754.
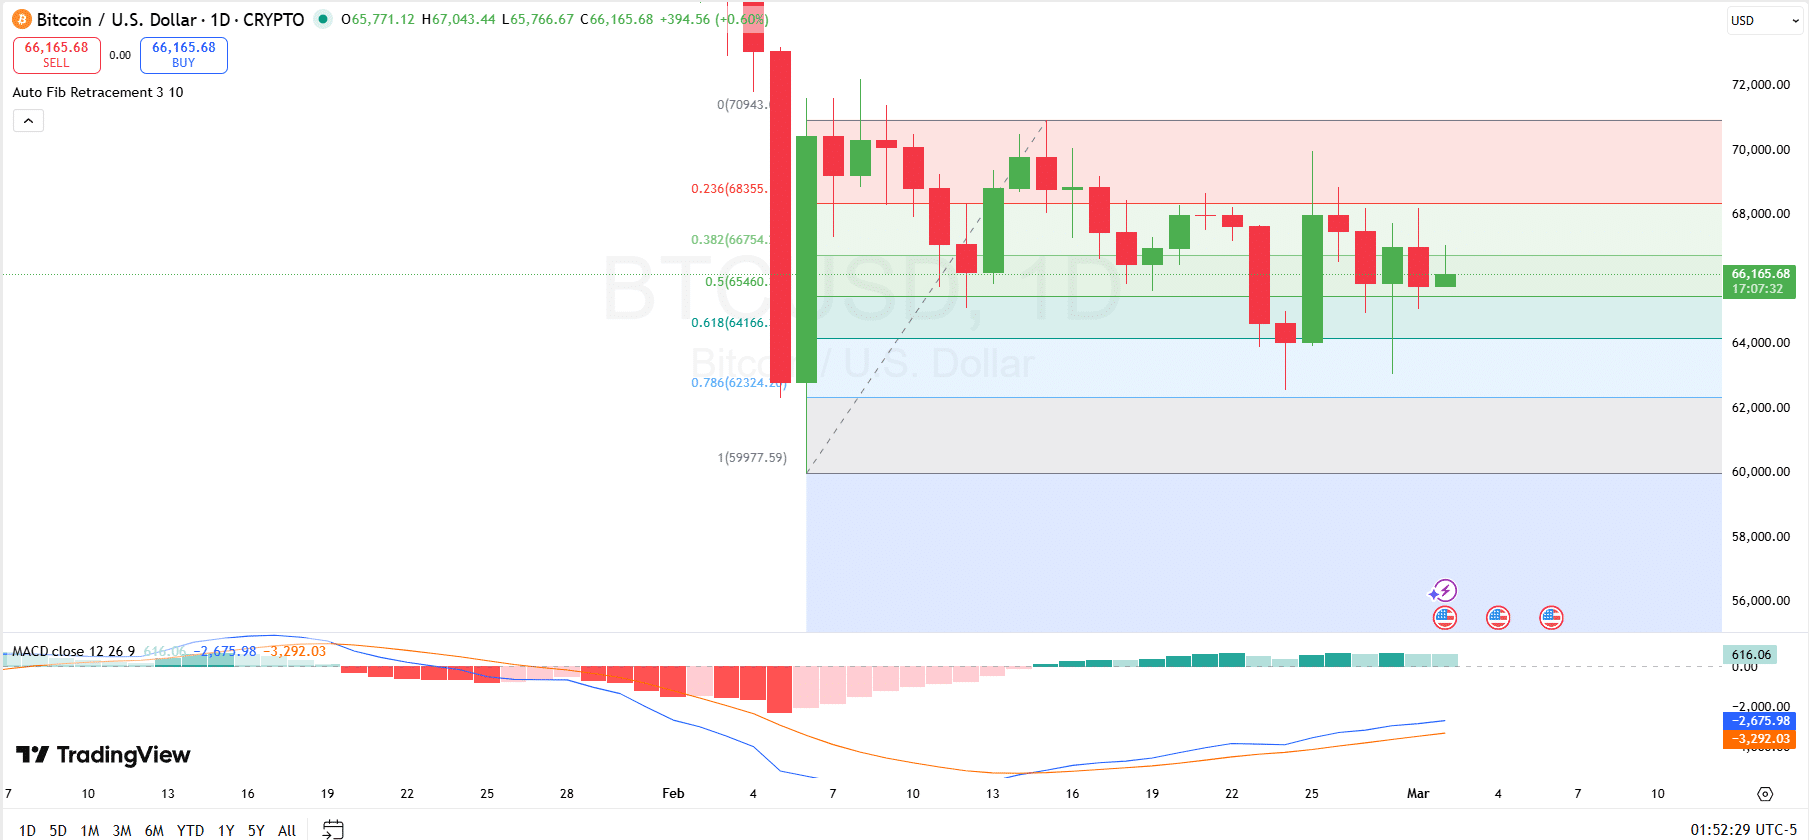
A decisive daily close above $66,754 would signal renewed bullish momentum and potentially open the door for a push toward the 0.236 level near $68,355 and possibly the $70,000 region. However, failure to close above this resistance could keep $BTC range-bound, with a likely retest of the 0.5 Fib support zone.
Momentum indicators support this inflection point narrative. The MACD has crossed bullishly, with the histogram now in the positive territory and gradually expanding, indicating strengthening upside momentum. Still, the move remains early.
If buying pressure accelerates alongside a breakout above the 0.382 Fib, Bitcoin could see another leg higher. Otherwise, rejection at current levels may trigger a pullback toward the 0.5 retracement before the next directional attempt.
$BTC Trades Below 100 and 200 Weekly EMA
Elsewhere, Arkham, an intelligence platform, notes that Bitcoin is now trading below both its 100-week and 200-week exponential moving averages. On the weekly chart, $BTC has broken beneath these long-term trend indicators following a sharp correction from its recent highs.
According to Arkham, the last time Bitcoin fell below both the 100-week and 200-week EMAs was in late 2023, shortly before it staged a powerful recovery that saw the price surge nearly 3x over the following six months. A 3x from the current value of $66,149 would place $BTC just shy of the $200,000 level. However, past successes do not guarantee future results.