Bitcoin currently trades within two massive liquidation clusters on the upside and downside, as traders anticipate the next decisive move.
Bitcoin (BTC) has continued to face bearish pressure as sellers try to push the asset into another monthly loss after its 14.82% drop in February 2026. Notably, the February decline marked the fifth straight month of losses, showing how strong the recent downtrend has been.
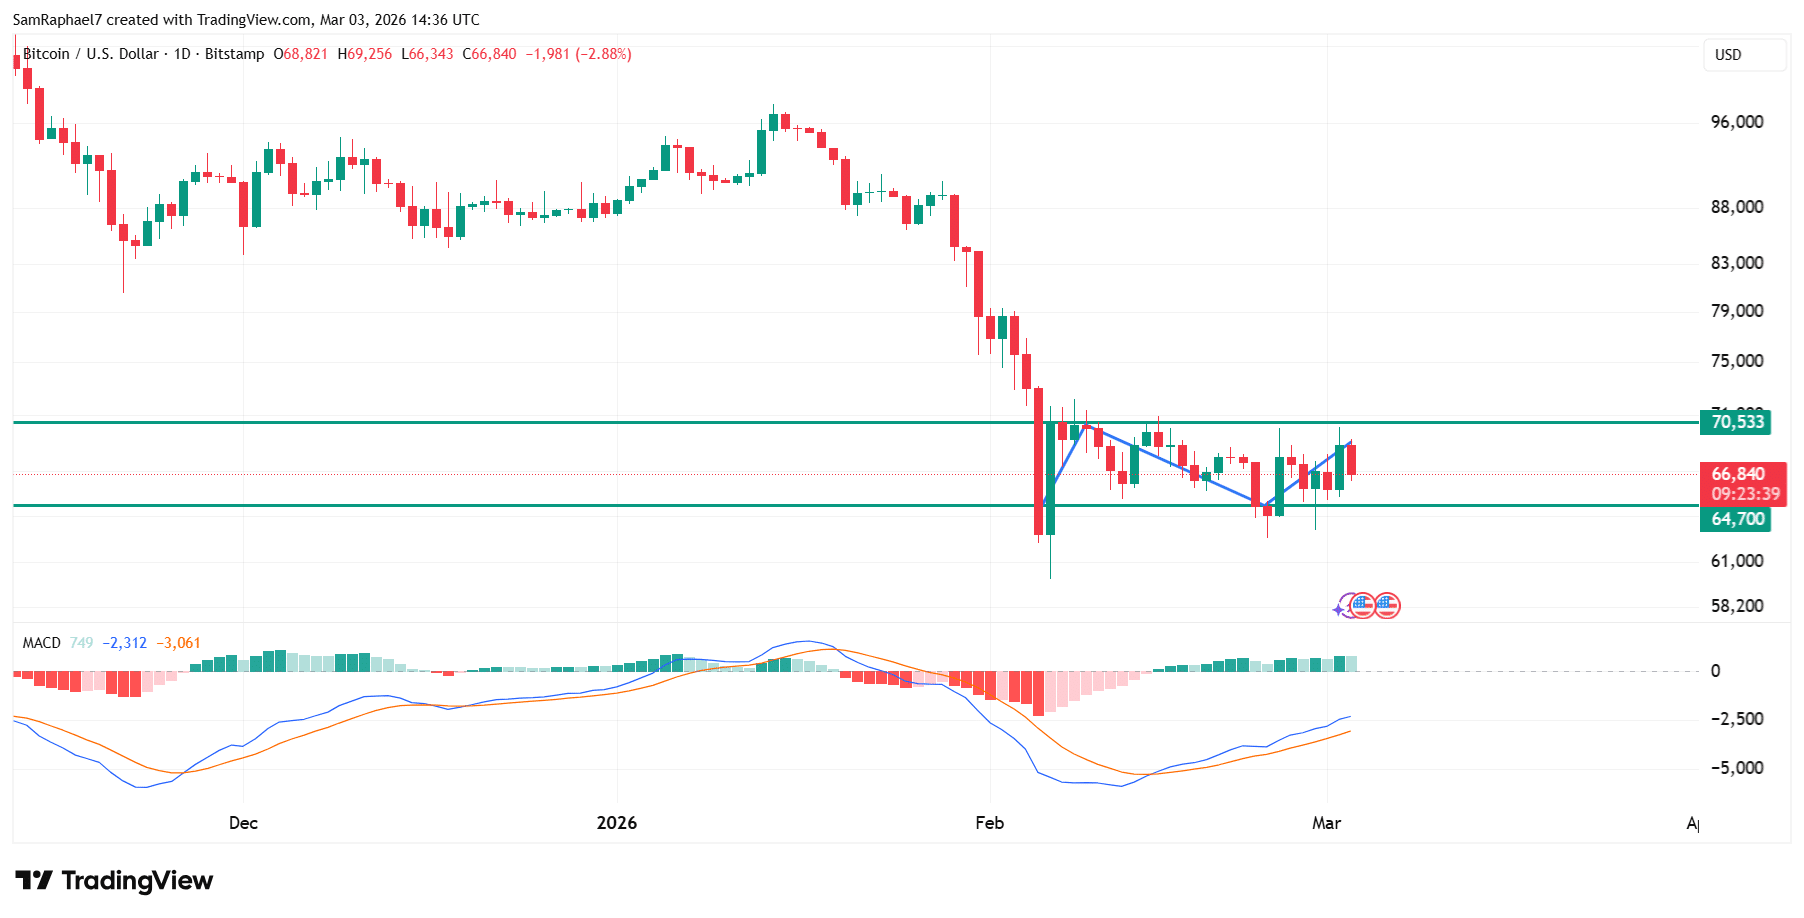
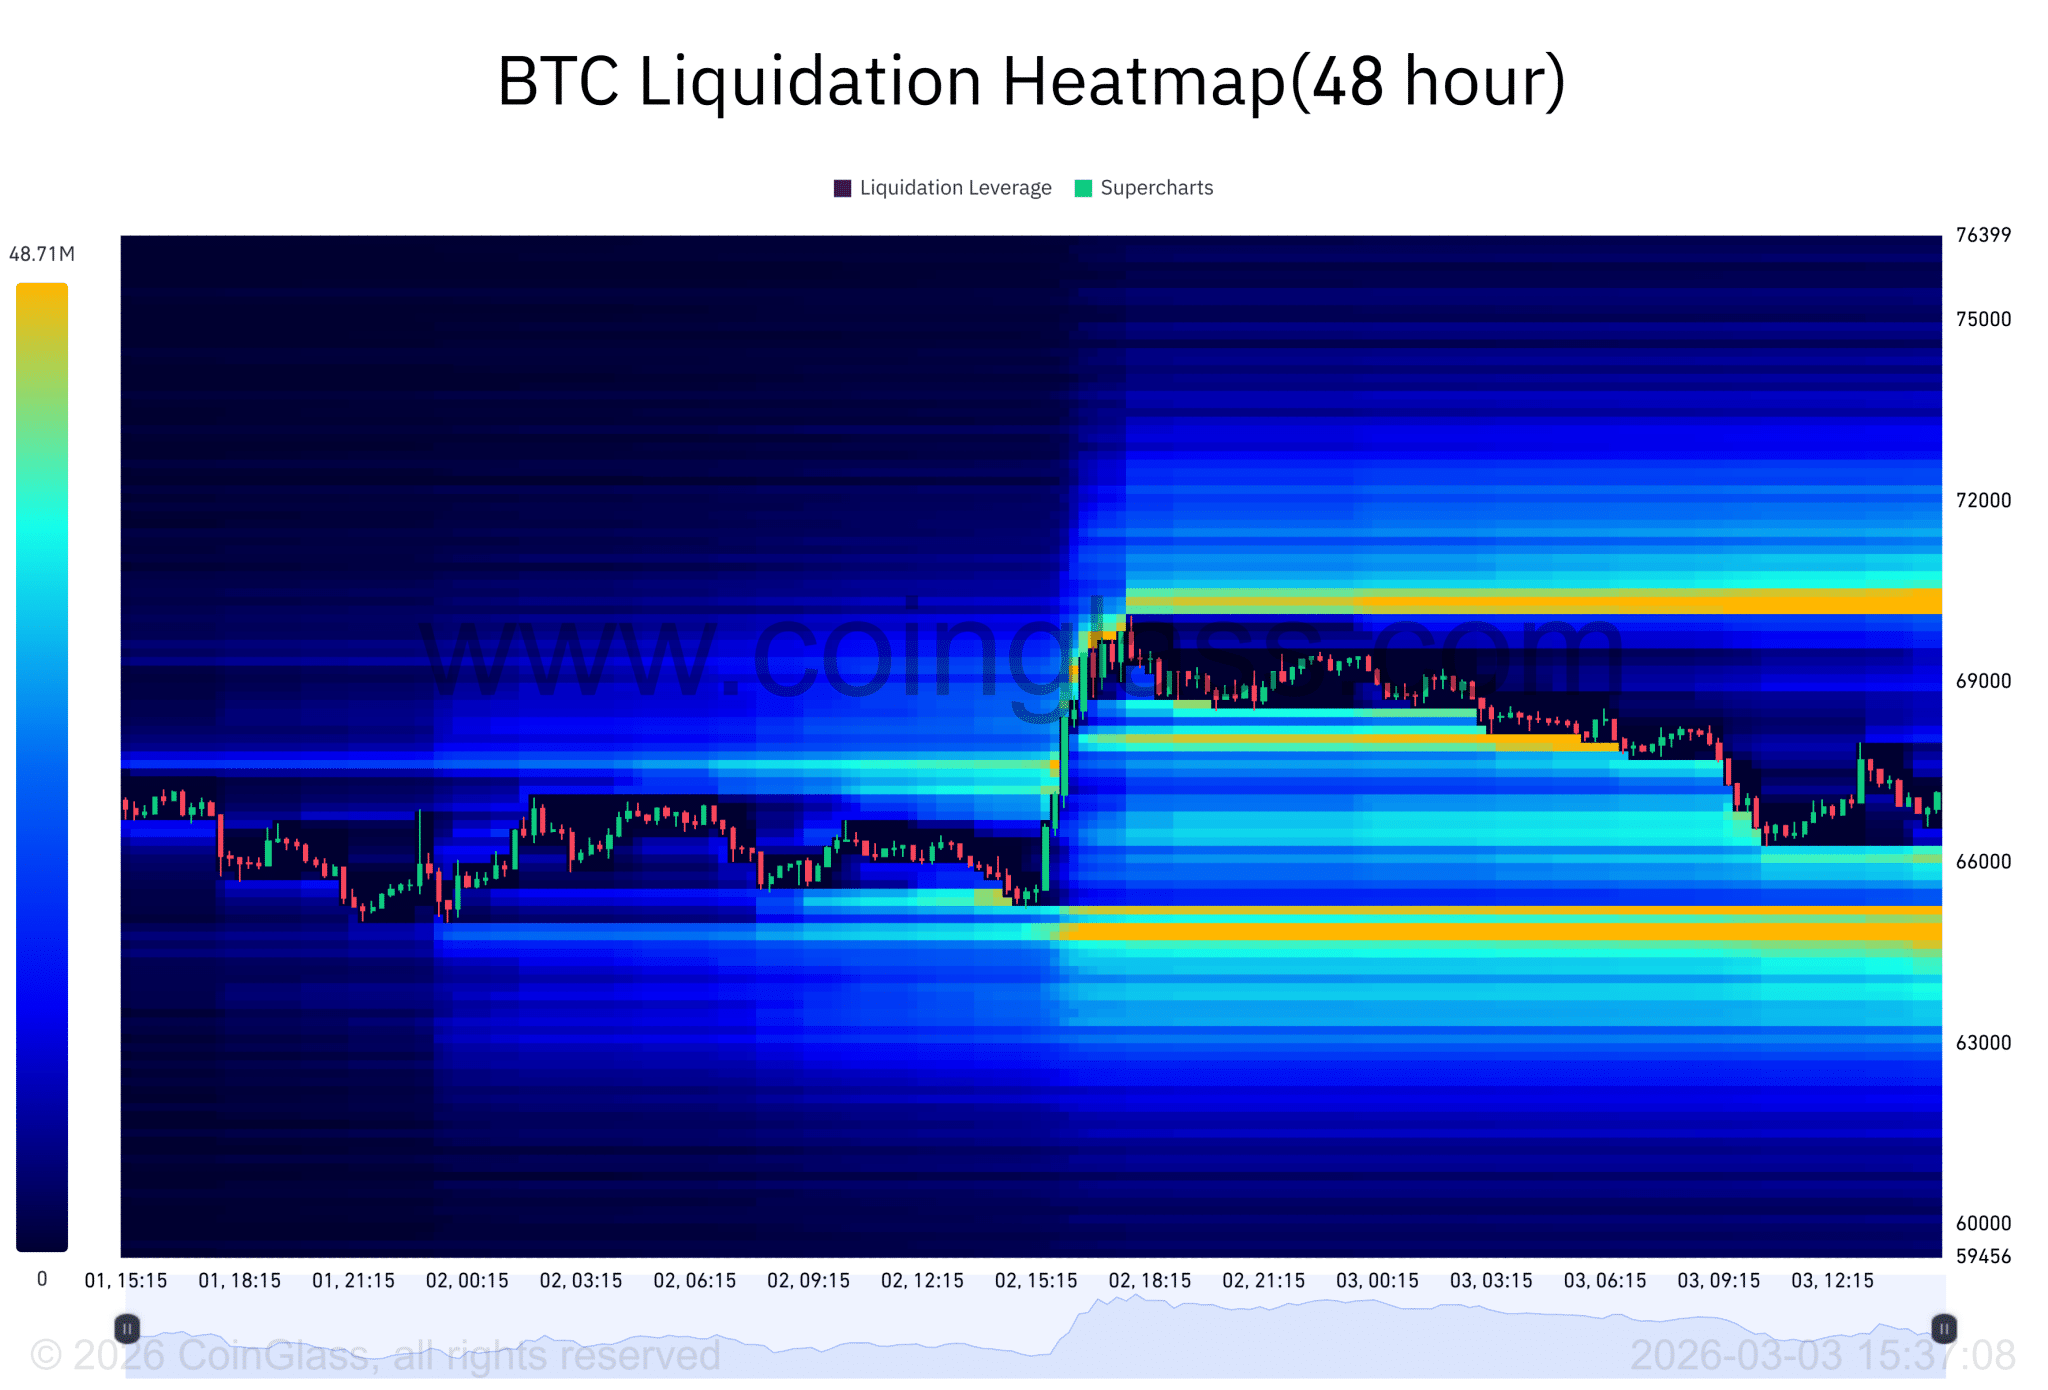
Right now, Bitcoin trades at around $67,000, sitting directly between two major liquidation zones at $65,000 and $70,500, with combined clusters worth up to $577 million. Data shows that whichever side prevails could decide where the price heads next.
Key Points
- Bitcoin dropped 14.82% in February 2026, marking its fifth consecutive monthly loss and extending a 41% decline since Q4 2025.
- Bitcoin has traded between $70,533 and $64,700 since early February, forming a tight 8.9% range.
- Bitcoin now sits between two massive liquidation clusters to the upside and downside, and the cohort that prevails could dictate the next direction.
- Liquidation data shows $254 million in leverage stacked above price up to $70,500 and $323 million below, around $65,000, totaling $577 million.
- A confirmed break above $70,533 could push the price toward $72,000-$74,000, while a breakdown below $64,700 may open the door to $62,000-$60,000.
Tight Range Building Pressure for Bitcoin
Notably, yesterday, on March 2, Bitcoin briefly climbed back above $70,000 for the first time since Feb. 25. However, while it gained 4.64% that day, it failed to hold above $70,000. Today, sellers have erased most of the gains, sending the price down 2.51% on the day and back to $67,000 at the time of writing.
Since early February 2026, when Bitcoin fell below $70,000, it has moved within a range between $70,533 and $64,700. As the price keeps bouncing between these levels, traders have built up large leveraged positions at both ends. This has created heavy liquidation clusters around $70,500 on the upside and $65,000 on the downside.
Traders betting on a breakout believe that a move above $70,500 will open the door for higher prices. On the other hand, those expecting a drop think that if $65,000 breaks, the selloff could speed up. At $67,000, Bitcoin sits in the middle of these two zones.
Why This Matters
Specifically, between $70,081 and $71,000, there is $254 million in liquidation leverage, with the biggest cluster around $70,368 worth $44.23 million, per data from Coinglass. On the downside, between $64,194 and $65,343, liquidation leverage totals $323 million.
Together, both sides add up to $577 million in potential liquidations. Bitcoin now trades about 5.2% above the $65,000 cluster and about 5.2% below the $70,500 cluster.
The current range between $70,533 and $64,700 is only about 8.9% wide. When prices tighten like this after a sharp drop, it often leads to a bigger move. As leverage builds around these levels, the price tends to move toward such areas to trigger liquidations.
The Bullish and Bearish Cases for Bitcoin
If Bitcoin breaks above $70,500, short sellers could get liquidated, which may add fuel to a rally. For the breakout to hold, the price would need strong spot buying, not just activity in derivatives markets.
A confirmed move would require a 4-hour or daily close above $70,533. If that happens, price could quickly move toward the $72,000 to $74,000 area, which marks the next likely liquidity zone.
However, traders should exercise some caution during such breakouts. Notably, if the price briefly moves above $70,500 but closes the day back below $70,000, while spot volume stays low and funding rates turn sharply positive, this could indicate a false breakout.
On the downside, Bitcoin would need a clean move below $65,000 with strong selling pressure and a 4-hour or daily close under $64,700 to confirm a breakdown. This move could trigger long liquidations and lead to a fast drop toward $62,000 or even $60,000.
Still, a quick dip below $65,000 followed by an immediate rebound could trap sellers. Notably, if buyers step in during the quick dip and open interest drops sharply, that would show that leverage has been flushed out and could indicate a potential reversal.
What to Watch Next
Traders should watch the Bitcoin open interest (OI) for useful Indicators. Specifically, if OI rises while price stays flat, it often signals that a breakout is building. Meanwhile, if open interest falls during a sharp move, this usually points to liquidations.
Meanwhile, funding rates also matter. Notably, very positive funding can mean too many traders are long, increasing downside risk, while very negative funding can signal crowded shorts and raise the chance of a squeeze.