Bitcoin continues to follow a long-term structural pattern that has shaped previous market cycles and remains bullish as long as this sustains.
The largest cryptocurrency by market cap is down 44% from its all-time high of $126,200 in October, a move that has rippled through the broader market. However, this could be part of a broader bullish picture, one that could see $BTC march on to unprecedented prices in the long term.
Key Points
- On the monthly timeframe, Bitcoin’s price movement still fits within a broad ascending channel that has guided its macro trajectory for years.
- Currently, Bitcoin trades at the midpoint of this long-term structure, an area historically marked with sharp corrections during bull markets.
- Previous cycles show that declines of roughly 15% to 36% have appeared during strong market phases at the midpoint without marking the end of the cycle.
- If the ascending channel structure continues to guide price behavior, then a reversal to the next stage of the cycle remains intact.
- The long-term support zone between $38,000 and $43,000 stands out as an important structural area, and breaking below would spark deeper declines.
Bitcoin Within Long-Term Ascending Channel
An analytical exposition from market technician EGRAG Crypto highlighted that, on the monthly timeframe, Bitcoin’s price movement still fits within a broad ascending channel that has guided its macro trajectory for years.
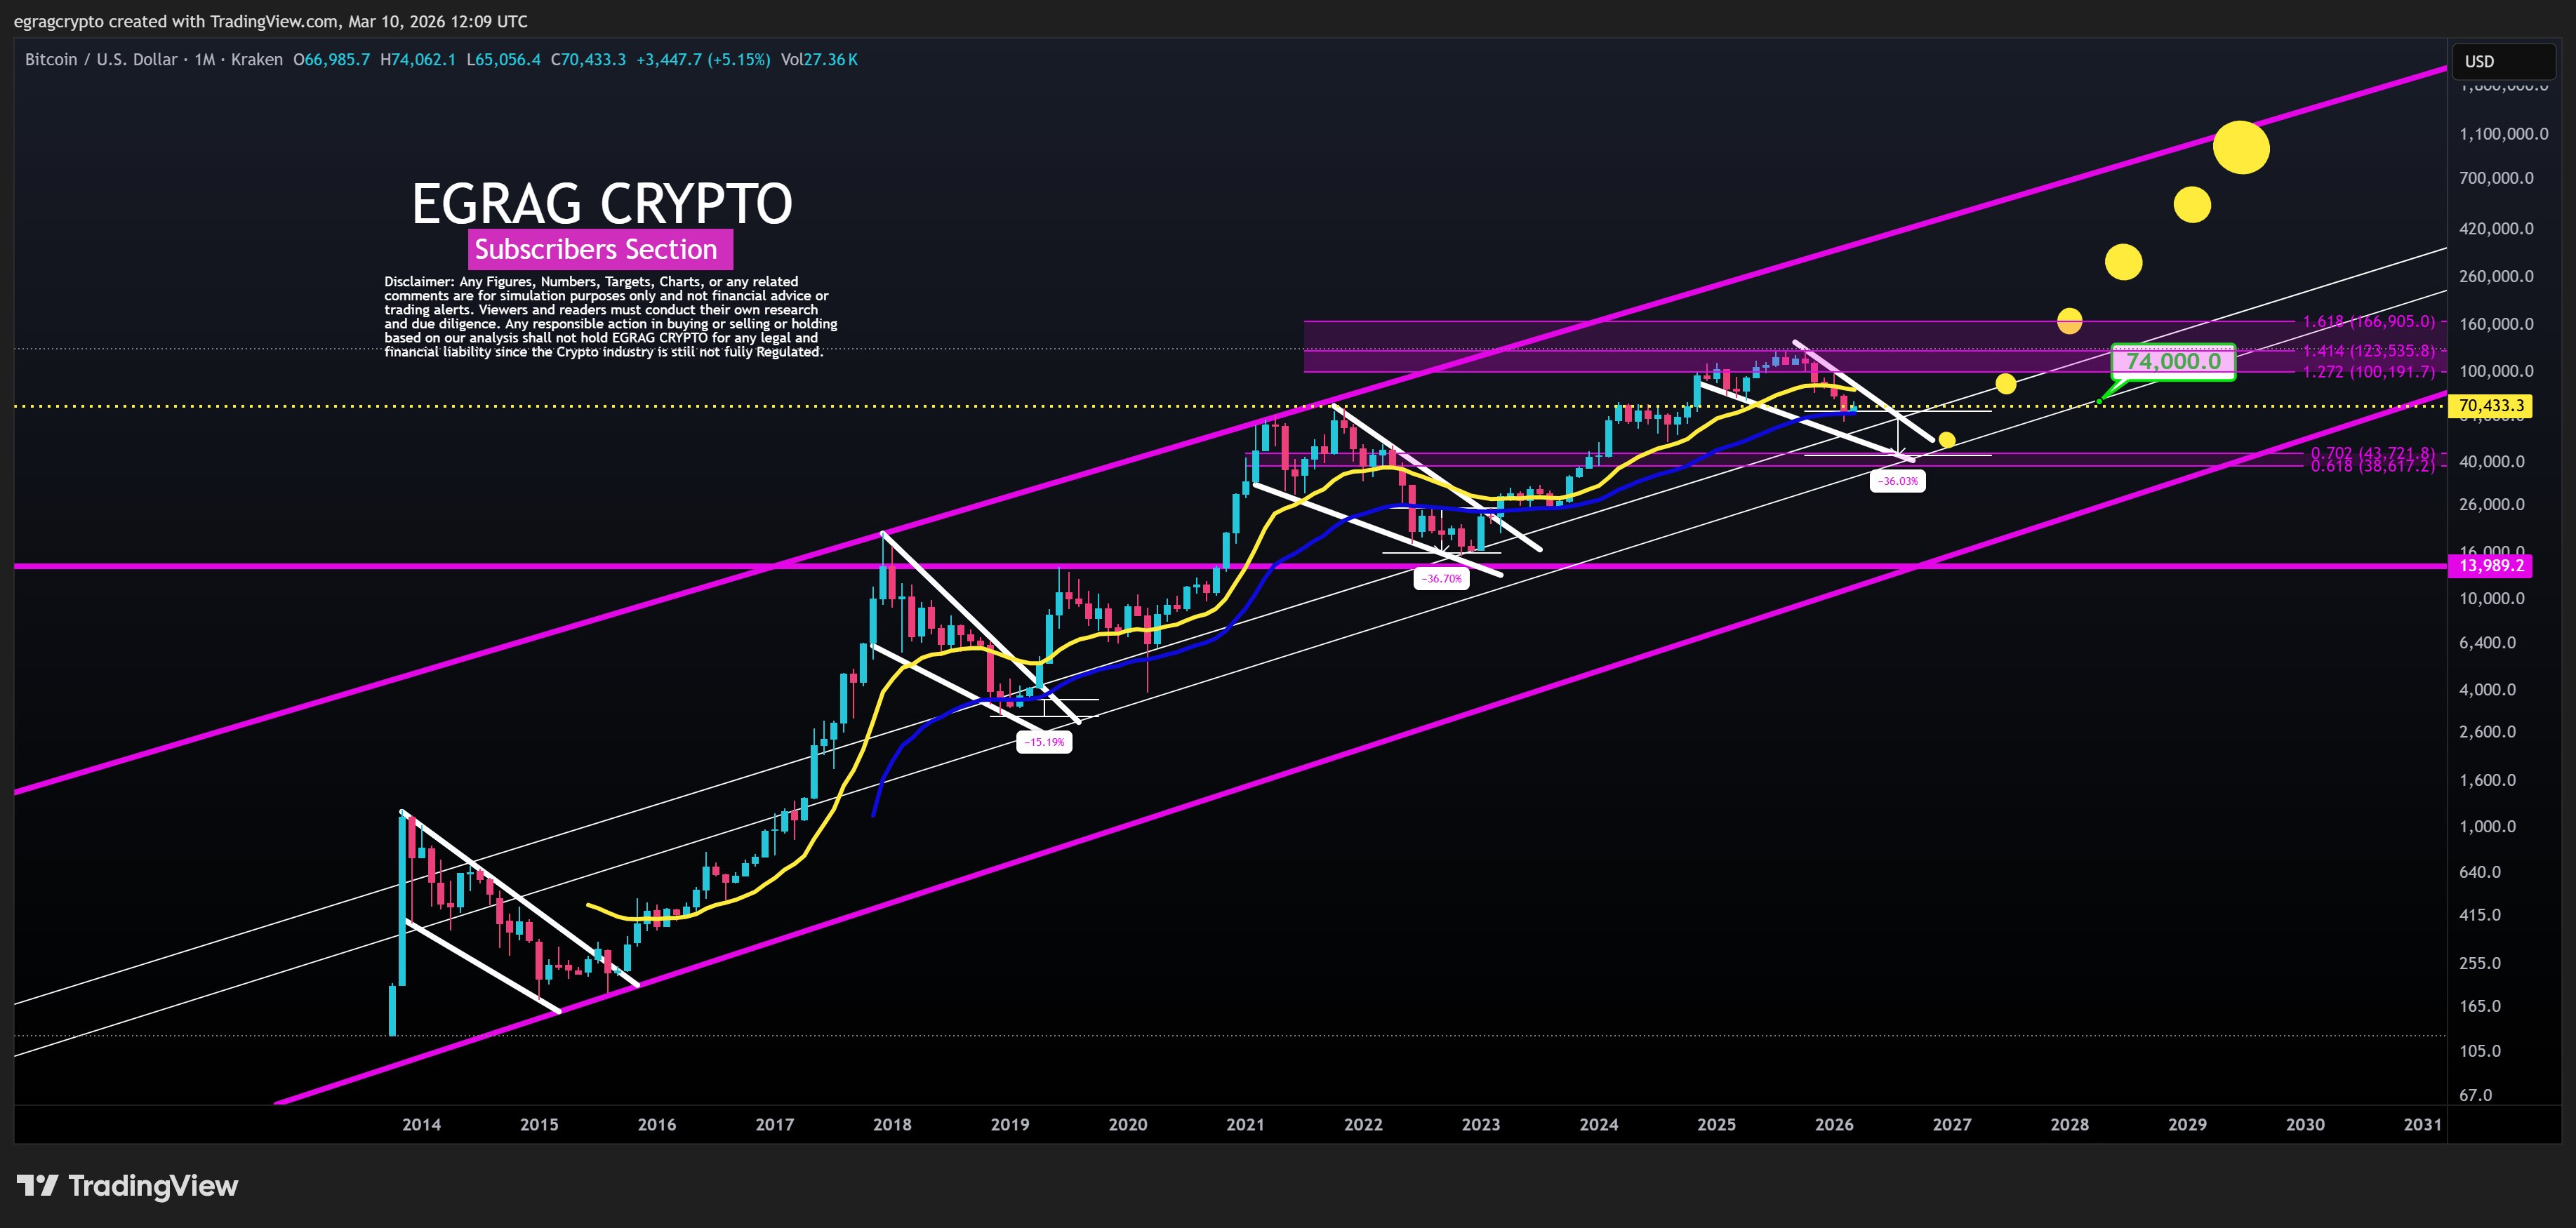
An accompanying chart confirms this, showing that $BTC has been in this wedge since 2014. Notably, this channel has historically acted as a framework for both market expansions and corrections, providing a reference for where major turning points tend to appear.
Throughout earlier cycles, Bitcoin repeatedly found support near the lower boundary of the channel before beginning a new expansion phase. In contrast, major upward movements have typically slowed or reversed when the price approached the upper boundary.
Currently, Bitcoin trades at the midpoint of this long-term structure, suggesting the broader bullish trend remains intact unless the coin breaks below the channel’s lower boundary.
Mid-Cycle Corrections Part of the Historical Pattern
Although the broader trend has remained upward across four cycles, Bitcoin has frequently experienced sharp corrections during bull markets. These pullbacks have often occurred even while the long-term structure stayed bullish.
Previous cycles show that declines of roughly 15% to 36% have appeared during strong market phases without marking the end of the cycle. For context, Bitcoin corrected by 15% in 2017 and by 36% in 2021, and a similar move could occur this cycle.
Because of this history, EGRAG views deep mid-cycle corrections as part of a long-standing market pattern rather than immediate signs of a long-term top.
Bitcoin Long-Term Target and Bullish Invalidation
If the ascending channel structure continues to guide price behavior, then a reversal to the next stage of the cycle remains intact. Under this framework, the next major price uptrend appears at the psychological $100,000 price mark, aligning with the 1.272 Fibonacci level.
The next level is $123,000, followed by a higher swing to $167,000, a new all-time high. These levels correspond to the 1.414 and 1.618 Fibonacci extensions, respectively.
Meanwhile, the long-term support zone between $38,000 and $43,000 stands out as an important structural area. Breaking below this region would put Bitcoin under severe pressure, with the next target at the channel’s lower support near $14,000.
EGRAG also highlighted two possible price trends for $BTC from here. One probable path is to hold the current support within a descending channel, then target a rebound to $74,000, then to $100,000, and subsequently to $123,000. However, the alternative path is a deeper corrective phase to revisit the $38,000 to $43,000 support before the next bullish phase begins.