Bitcoin holds above key technical support while major liquidity zones continue to shape expectations for the next move.
At $69,503.85, Bitcoin ($BTC) is down 1.9% on the day and trading just above the session low of $69,400.30 after hitting its high of $71,612.49. That intraday path reflects rejection, not just weakness.
Price briefly pushed above $71,600, failed to hold that expansion, and then spent the rest of the session compressing lower toward the bottom of the range. Performance-wise, $BTC is still up 6.9% over 14 days, yet it is flat on the week, down 1.6% on the month, and down 13.5% over one year.
That mix suggests Bitcoin is not in a clean trend expansion, but in a revaluation zone where medium-term recoveries keep running into sellers. Notably, $BTC traders will now be watching whether this rejection is just noise or the start of a deeper reset.
Is Bitcoin Already Rejected?
Notably, price is trading around $69,500 while the Parabolic SAR sits lower near $64,067. The chart suggests the market may be consolidating above support instead of facing outright rejection. Additionally, bulls are still holding a narrow structural advantage as long as the price remains above that Parabolic SAR support.
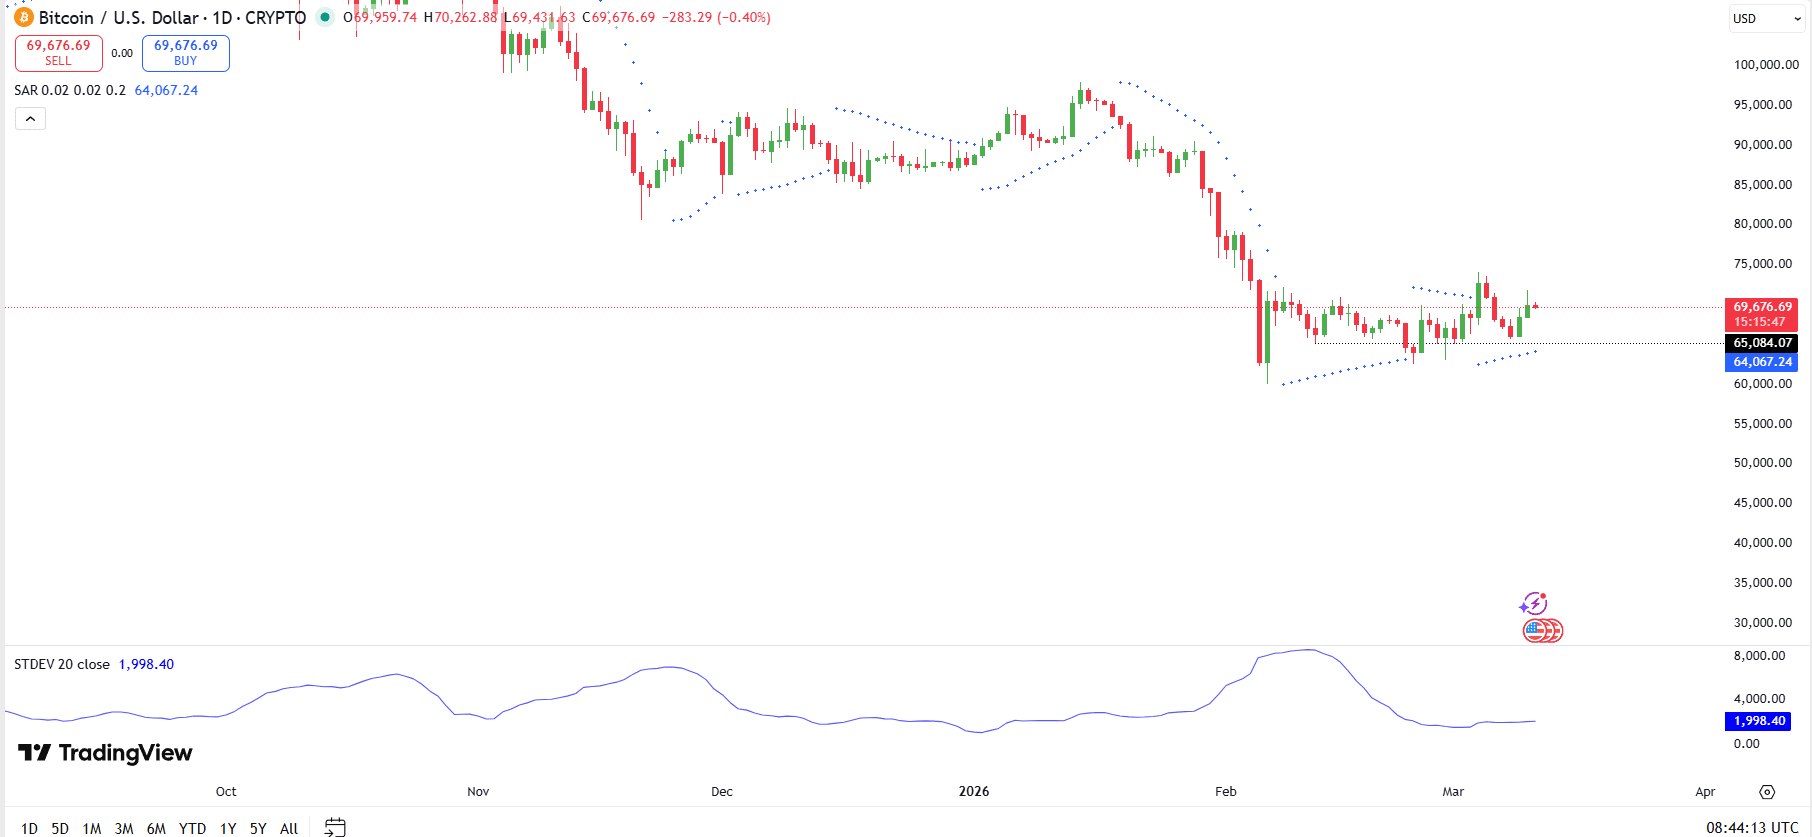
Another important detail is volatility. Specifically, the 20-day standard deviation sits near 1,998, far below the spike seen during the February selloff, showing that price swings have cooled. This drop in volatility usually signals that panic conditions are fading and the market is entering a compression phase.
That does not guarantee an upside breakout, but it does suggest Bitcoin is moving out of disorder and into a more controlled range. Ultimately, Bitcoin’s technical picture is no longer defined purely by rejection risk; it is now defined by whether this low-volatility hold above Parabolic SAR can evolve into a base-building structure.
Here Are Key Liquidity Clusters
Meanwhile, analyst Crypto Rover also highlighted several key Bitcoin liquidity clusters on the Binance $BTC/USDT liquidation heatmap. The chart shows dense liquidation pockets above the market around the low-$70,000s and again near the mid-$70,000 region, while a notable downside cluster sits near the mid-$60,000s.

This setup suggests Bitcoin is trading between meaningful liquidity magnets, with upside zones more likely to attract price if bullish momentum strengthens. On the other side, the lower band around $65,000 remains an important downside draw if the market loses support.