Bitcoin is sitting between two important signals that could shape its next move. One chart points to a possible accumulation setup, while another shows a resistance band that could decide whether the recovery keeps going.
Bitcoin Cost Basis Signal Points to Possible Accumulation Phase
A chart shared by analyst Ali Charts shows short term Bitcoin holders’ realized price at about $87,392, while the long term holders’ realized price stands near $47,531. Bitcoin itself is shown trading around $67,332. The setup focuses on the relationship between short term and long term holder cost basis, which traders often use to track cycle turning points.
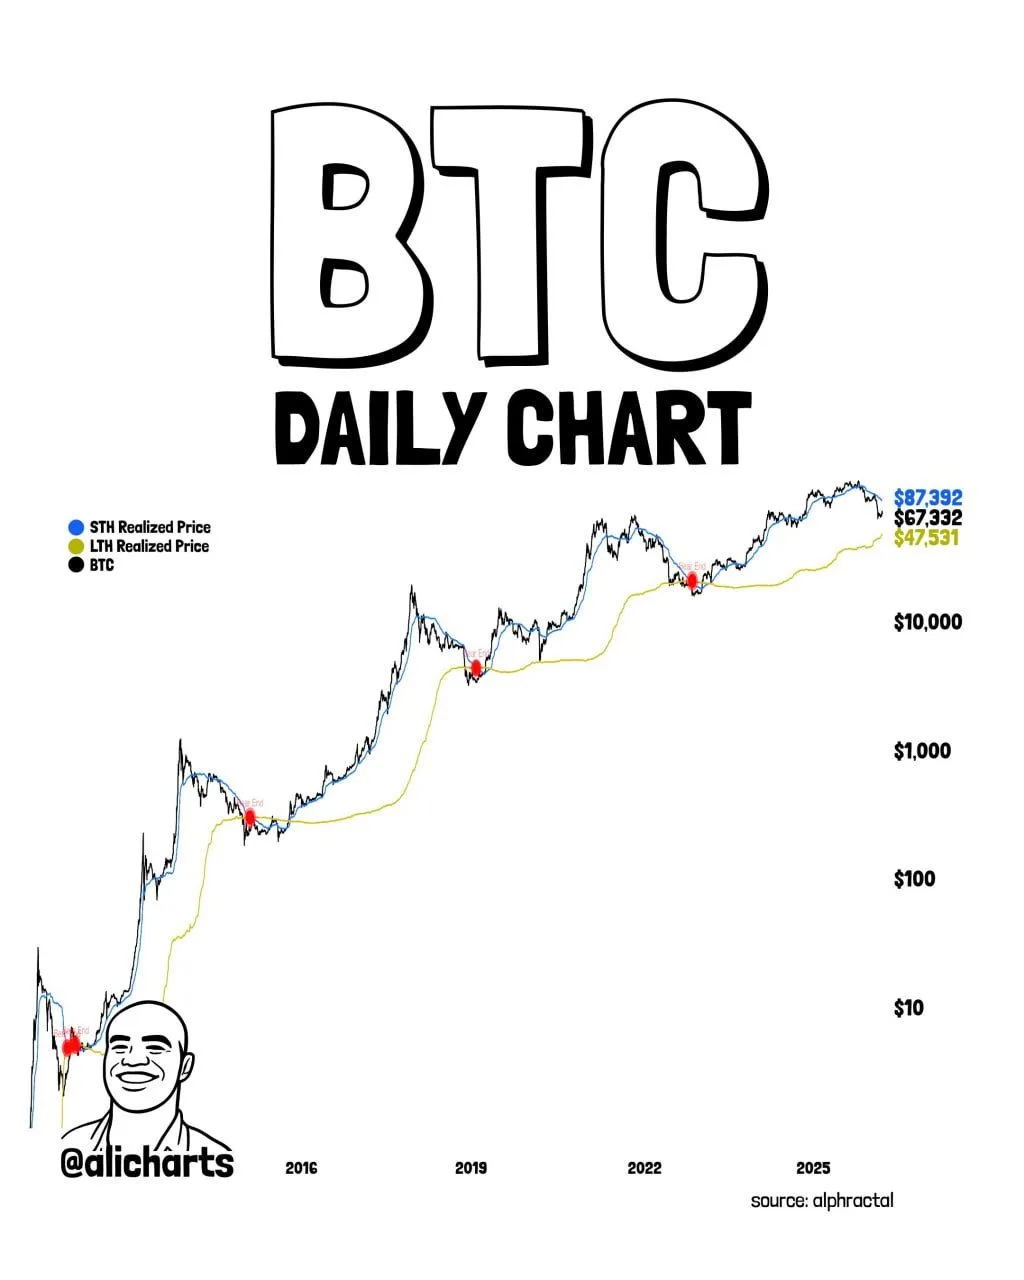
Bitcoin Daily Chart. Source: Ali Charts / Alphractal
According to the analysis, when the short term holders’ cost basis drops below the long term holders’ cost basis, Bitcoin has often approached a market bottom. The chart marks several past bear market endings where that crossover appeared before a new accumulation phase started. In those periods, price later moved into a broader recovery trend.
Right now, the short term holders’ realized price still remains above the long term holders’ realized price. That means the historical bottom signal shown on the chart has not fully triggered yet. Even so, Bitcoin is trading below the short term holder cost basis, which suggests newer buyers are under pressure, while long term holders still sit far lower on the curve.
The structure matters because realized price tracks the average on chain acquisition cost of different holder groups. When short term holders fall below long term holders, it usually reflects heavy capitulation from newer market participants. That shift has often appeared near late stage bearish conditions.
Bitcoin Tests Key Resistance Band as Analysts Map Next Technical Levels
A chart shared by analysts at More Crypto Online shows Bitcoin approaching a defined resistance zone between $68,795 and $72,205. The range is based on Fibonacci retracement levels and previous market structure points that often act as barriers during recoveries.
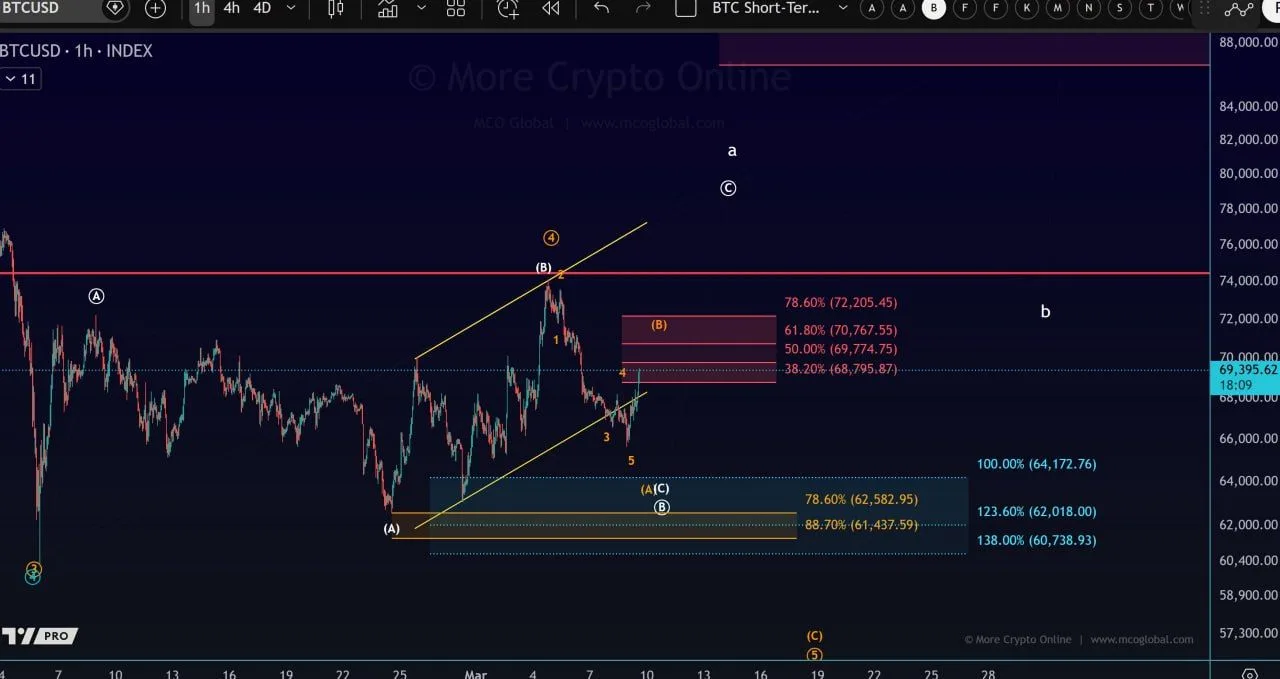
Bitcoin 1 Hour Chart. Source: More Crypto Online
The chart highlights several retracement levels inside the resistance band. These include the 38.2%, 50%, 61.8%, and 78.6% Fibonacci levels. Technical analysts frequently monitor these zones because price often pauses or reverses when approaching them after a decline.
In addition, the chart outlines a wave structure that suggests Bitcoin may be moving through a corrective phase before a larger directional move. The structure marks several waves forming within a broader pattern, which traders use to estimate where resistance or support could appear.
Below the resistance band, the chart also identifies a deeper support region between roughly $60,700 and $64,100. This area corresponds with Fibonacci extension levels and previous reaction points that historically attracted buying interest during pullbacks.
For now, the focus remains on the upper resistance range. If Bitcoin breaks above the zone, analysts may watch whether the market can continue building momentum. However, if the range holds as resistance, price could revisit lower support levels before attempting another move higher.