Bitcoin is trading between heavy resistance above and strong bid support below, while liquidity data shows the market is nearing a decision point. If one side breaks, the next move could accelerate fast as price targets the next major liquidity cluster.
Bitcoin Heatmap Shows Support Building Above Channel Break
A Bitcoin heatmap shared by Columbus suggests the market is starting to accept price action above a descending channel, while fresh bid liquidity appears across the order book. The chart points to a possible structural shift as support begins to build around lower levels after the recent move higher.
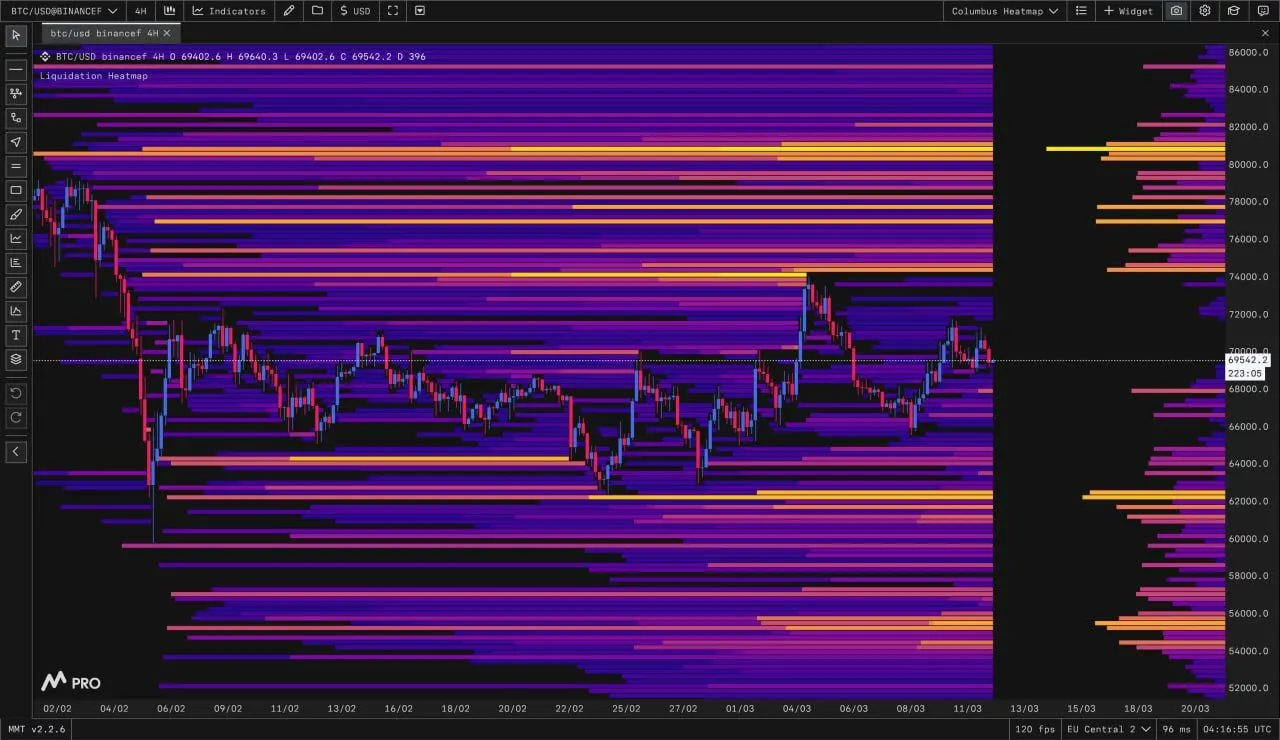
Bitcoin MMT Heatmap. Source: Columbus
The visual shows dense liquidity clusters both above and below the current trading zone, with notable bid interest forming near the $68,000 area. According to the analysis, that level matches the former channel resistance and may now act as support if Bitcoin pulls back. This kind of retest often helps confirm whether a breakout is holding.
At the same time, the heatmap shows heavier liquidity sitting overhead, especially in the higher price zones. If Bitcoin continues to hold above the broken channel, that overhead liquidity could become the next draw for price. In that case, the market may move quickly toward those levels as traders target areas with larger resting orders.
The chart therefore suggests a two-step structure. First, Bitcoin may revisit the $68,000 zone where bids are already visible. Then, if buyers defend that area, the broader setup could support continuation toward higher liquidity clusters above the current range.
Bitcoin Whale Orders Point to Fast Move Once the Range Breaks
Meanwhile, Bitcoin is trading inside a tight whale liquidity zone, with heavy sell orders stacked between $71,000 and $72,500 and strong bid support clustered around $69,000 to $68,700, according to a CoinGlass whale order chart. That setup suggests price is being compressed between large opposing liquidity blocks, which often leads to a sharper move once one side gives way.
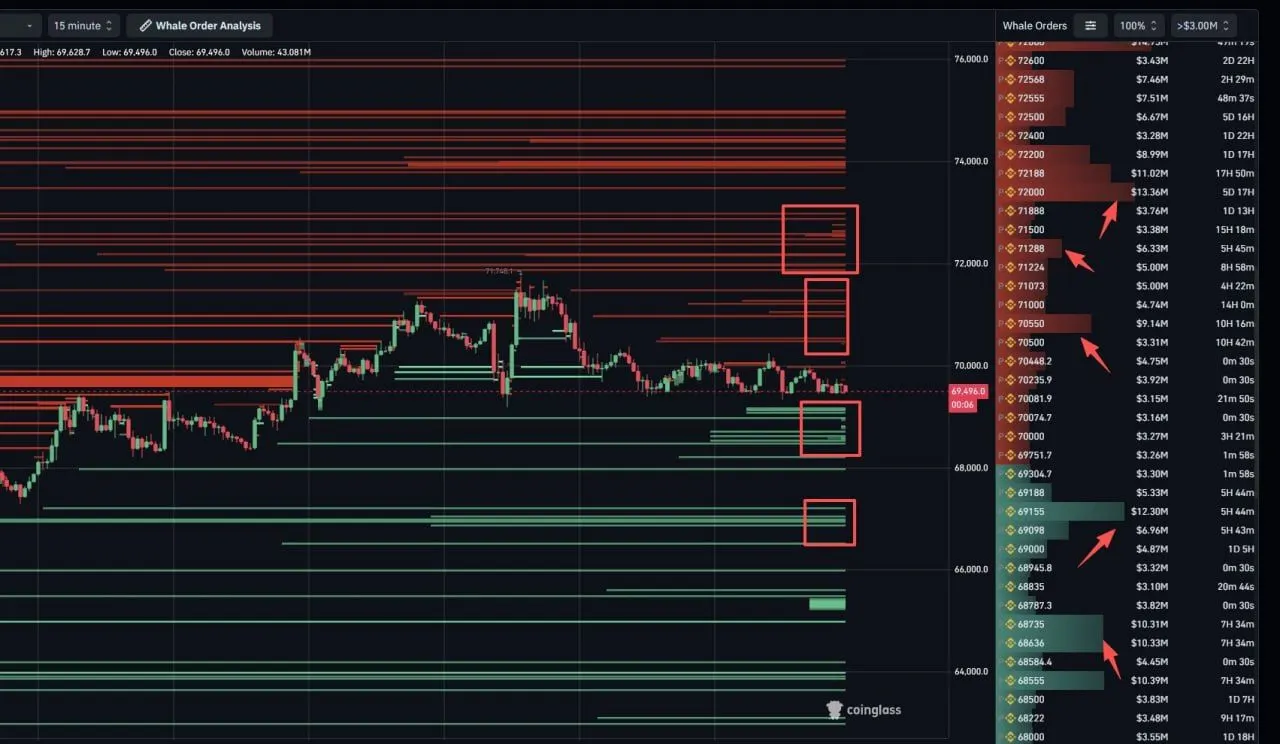
Bitcoin Whale Order Analysis. Source: CoinGlass
The chart shows repeated sell walls above the current range, especially near the low-$71,000 area and again closer to $72,000 to $72,500. At the same time, several bid clusters sit below price around $69,000, with another deeper support zone forming near $68,700. This leaves Bitcoin boxed between nearby resistance and support created by larger market participants.
Because price is sitting closer to the lower half of that range, the immediate pressure appears slightly tilted downward unless buyers reclaim the upper liquidity band. If Bitcoin loses the $69,000 support area, the next move could extend quickly toward the deeper bid zones below, since liquidity gaps often allow faster price movement. On the other hand, if buyers absorb the sell walls and push above $71,000 to $72,500, that would signal stronger momentum and could open the way for a more aggressive upside expansion.
In other words, the chart points to a market waiting for resolution. As long as Bitcoin stays trapped between these whale levels, price may remain choppy. However, once the range breaks, the concentration of orders on both sides suggests the next move could be fast and directional.