- The Bitcoin price is poised for 5% recovery before channeling the resistance trendline of channel pattern.
- According to Farside investor data, the U.S. based spot $BTC ETFs collectively attracted a $199.4 inflow on Monday.
- The crypto fear and greed sentiment at 28% indicate the broader market sentiment in still bearish
The pioneer cryptocurrency Bitcoin recorded a 2.4% jump on Monday to trade at $75,835. The buying pressure followed a fresh comment from U.S. president Donald Trump claiming “wants to make a deal” to end the ongoing conflict. The coin price witnessed additional momentum amid the returning inflow to its U.S based $BTC ETFs (exchange traded funds) and on-chain data signaling conviction from long-term holders. Is Bitcoin price ready to reclaim the $80,000reclaim the $80,000 mark?
Historic Low in Coin Days Destroyed Signals Strong Holding Trend
Bitcoin’s Coin Days Destroyed Multiple indicator has hit its lowest reading since 2022 in data released on March 16th 2026 by Alphractal. The measurement, which appears as orange bars on a chart over several years, is close to the bottom of the range while the white line, which tracks Bitcoin’s price, overlays it in the price. $100,000.
The ratio compares coin days destroyed daily as compared to a long-term average to gauge activities of Bitcoin accumulated years ago. Current levels are characterised by extremely low levels of destruction of those accumulated days, meaning units bought in previous cycles reflect almost no transfers on the blockchain.
As a result, the volume of transactions is now coming largely not from old collected Bitcoin but from more recently acquired Bitcoin. Earlier high-price phases seemingly had many long duration owners change positions thus leaving fresher supply to dominate daily flows.
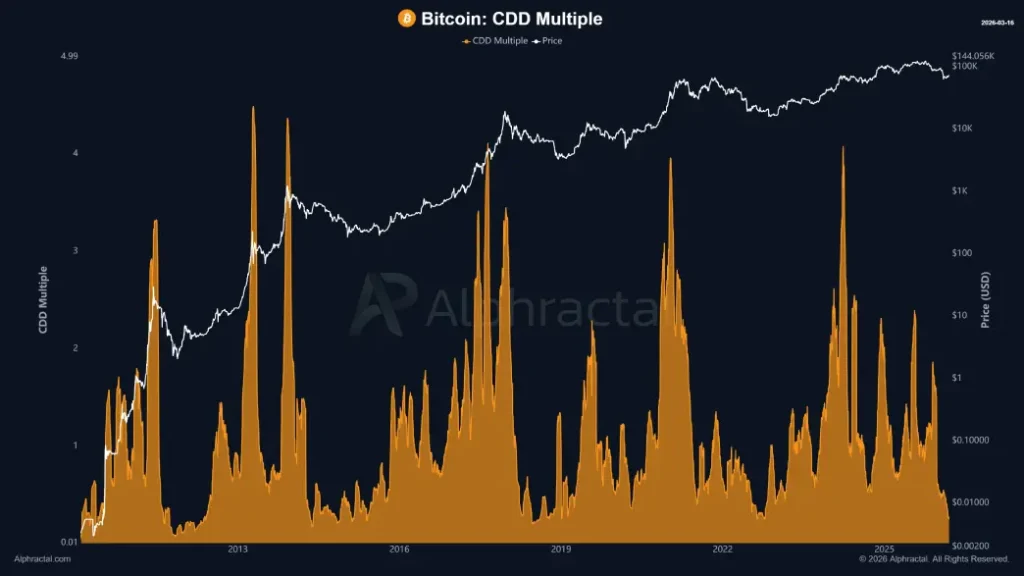
The Alphractal visualization goes back more than 10 years and shows the recurring spikes in the orange series during previous valuation booms around 2013, 2017 and 2021. The latest dip in the multiple is met with a price line stabilization at higher levels through early 2026.
Channel Patten Drives Mid-Term Downtrend In Bitcoin Price
In an 8-day rally, the Bitcoin price witnessed a notable recovery from $65,844 to $74,578 current trading value, registering a gain of 13.78%. This bullish upswing gave a decisive breakout from an immediate resistance of $73,901, signaling the buyer’s escape from five weeks long consolidation.
Amid the geopolitical tension in the middle east this sideways action offered an accumulation zone to $BTC buyers and replenished the bullish momentum. The momentum indicator RSI (Relative Strength index) at 60% supports the recovery narrative in price.
The post-breakout rally could push the asset another 5.5% before challenging the key resistance trendline at falling channel pattern at $78,385.
Since October 2025, the Bitcoin price has experienced a steady correction trend resonating within the two parallel trendlines of this pattern. The potential retest to the pattern’s resistance trendline acts as a major pivot floor for $BTC.
Therefore, a potential breakout from the resistance will intensify the bullish momentum for a prolonged recovery to $100k.
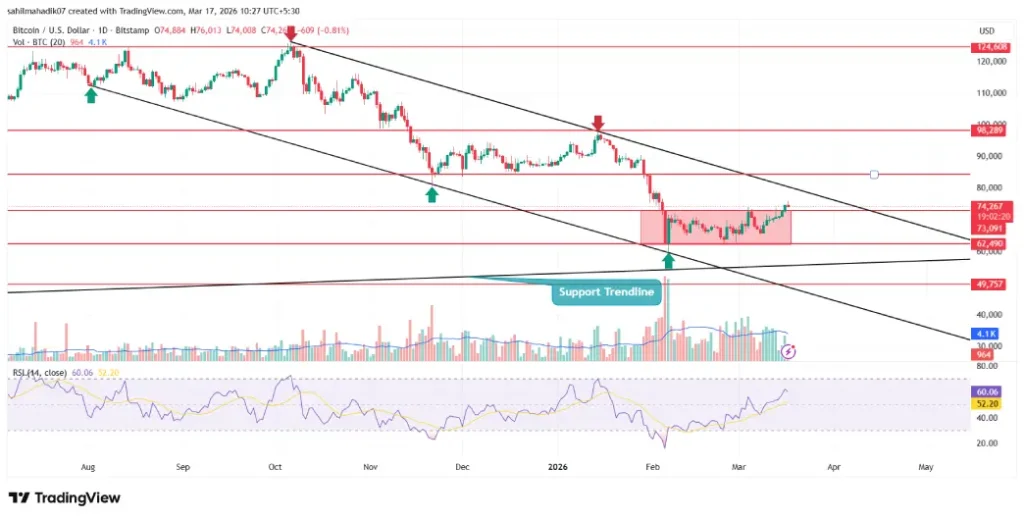
On the contrary, the Bitcoin price reverts from the upper boundary with a bearish reversal signal, sellers could force a continued correction and drop to $50,000 mark.