Bitcoin traded at $68,351 on March 22, 2026, with a market cap of around $1.36 trillion and a 24-hour volume of $20.6 billion, as price action oscillated between $68,211 and $70,978. The broader technical posture remained neutral overall, though underlying indicators and moving averages (MAs) suggested increasing downside pressure beneath the surface.
Bitcoin Chart Outlook
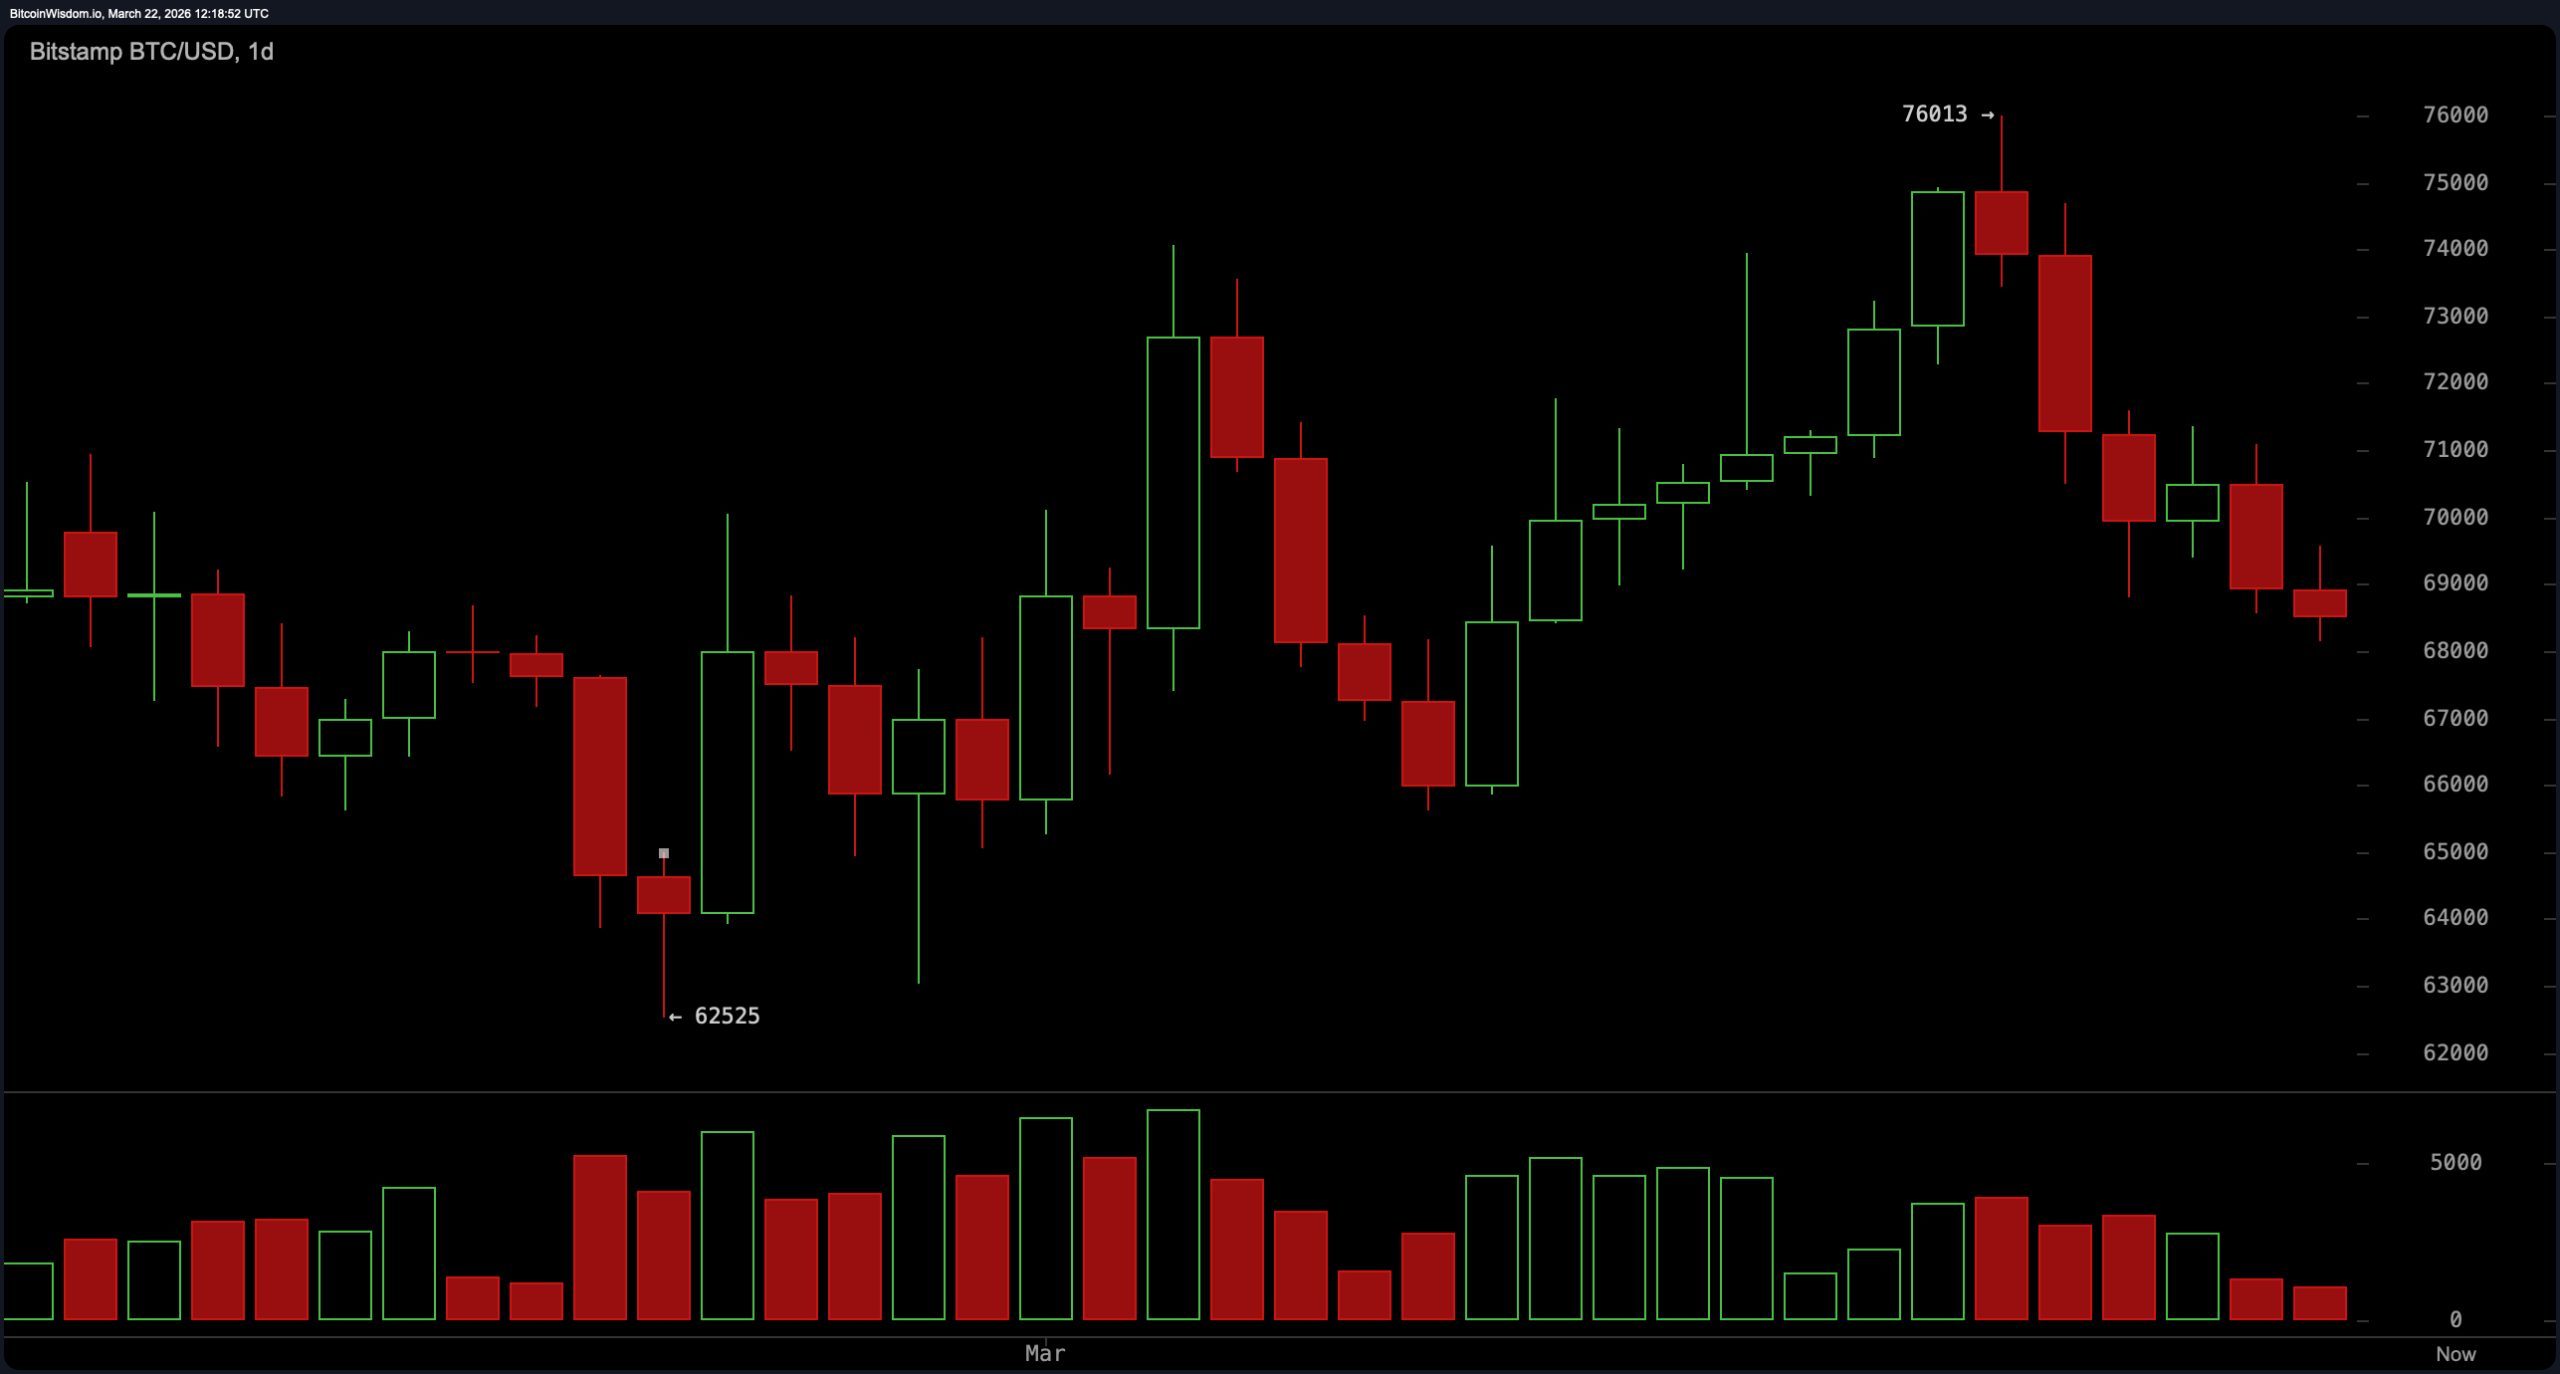
Bitcoin is holding steady after the drawdown that followed U.S. President Trump’s renewed threats to Iran on Saturday evening. On the daily chart, bitcoin reflected a cooling phase following a rejection near the $70,978 intraday high, slipping back into a consolidation band just above the $68,200 level. Price action remained contained within a relatively tight range, signaling indecision rather than outright directional conviction.
While the structure did not confirm a full breakdown, the inability to sustain higher levels hinted at waning bullish momentum, with volatility compressing into a narrow band near $68,500 to $69,000.
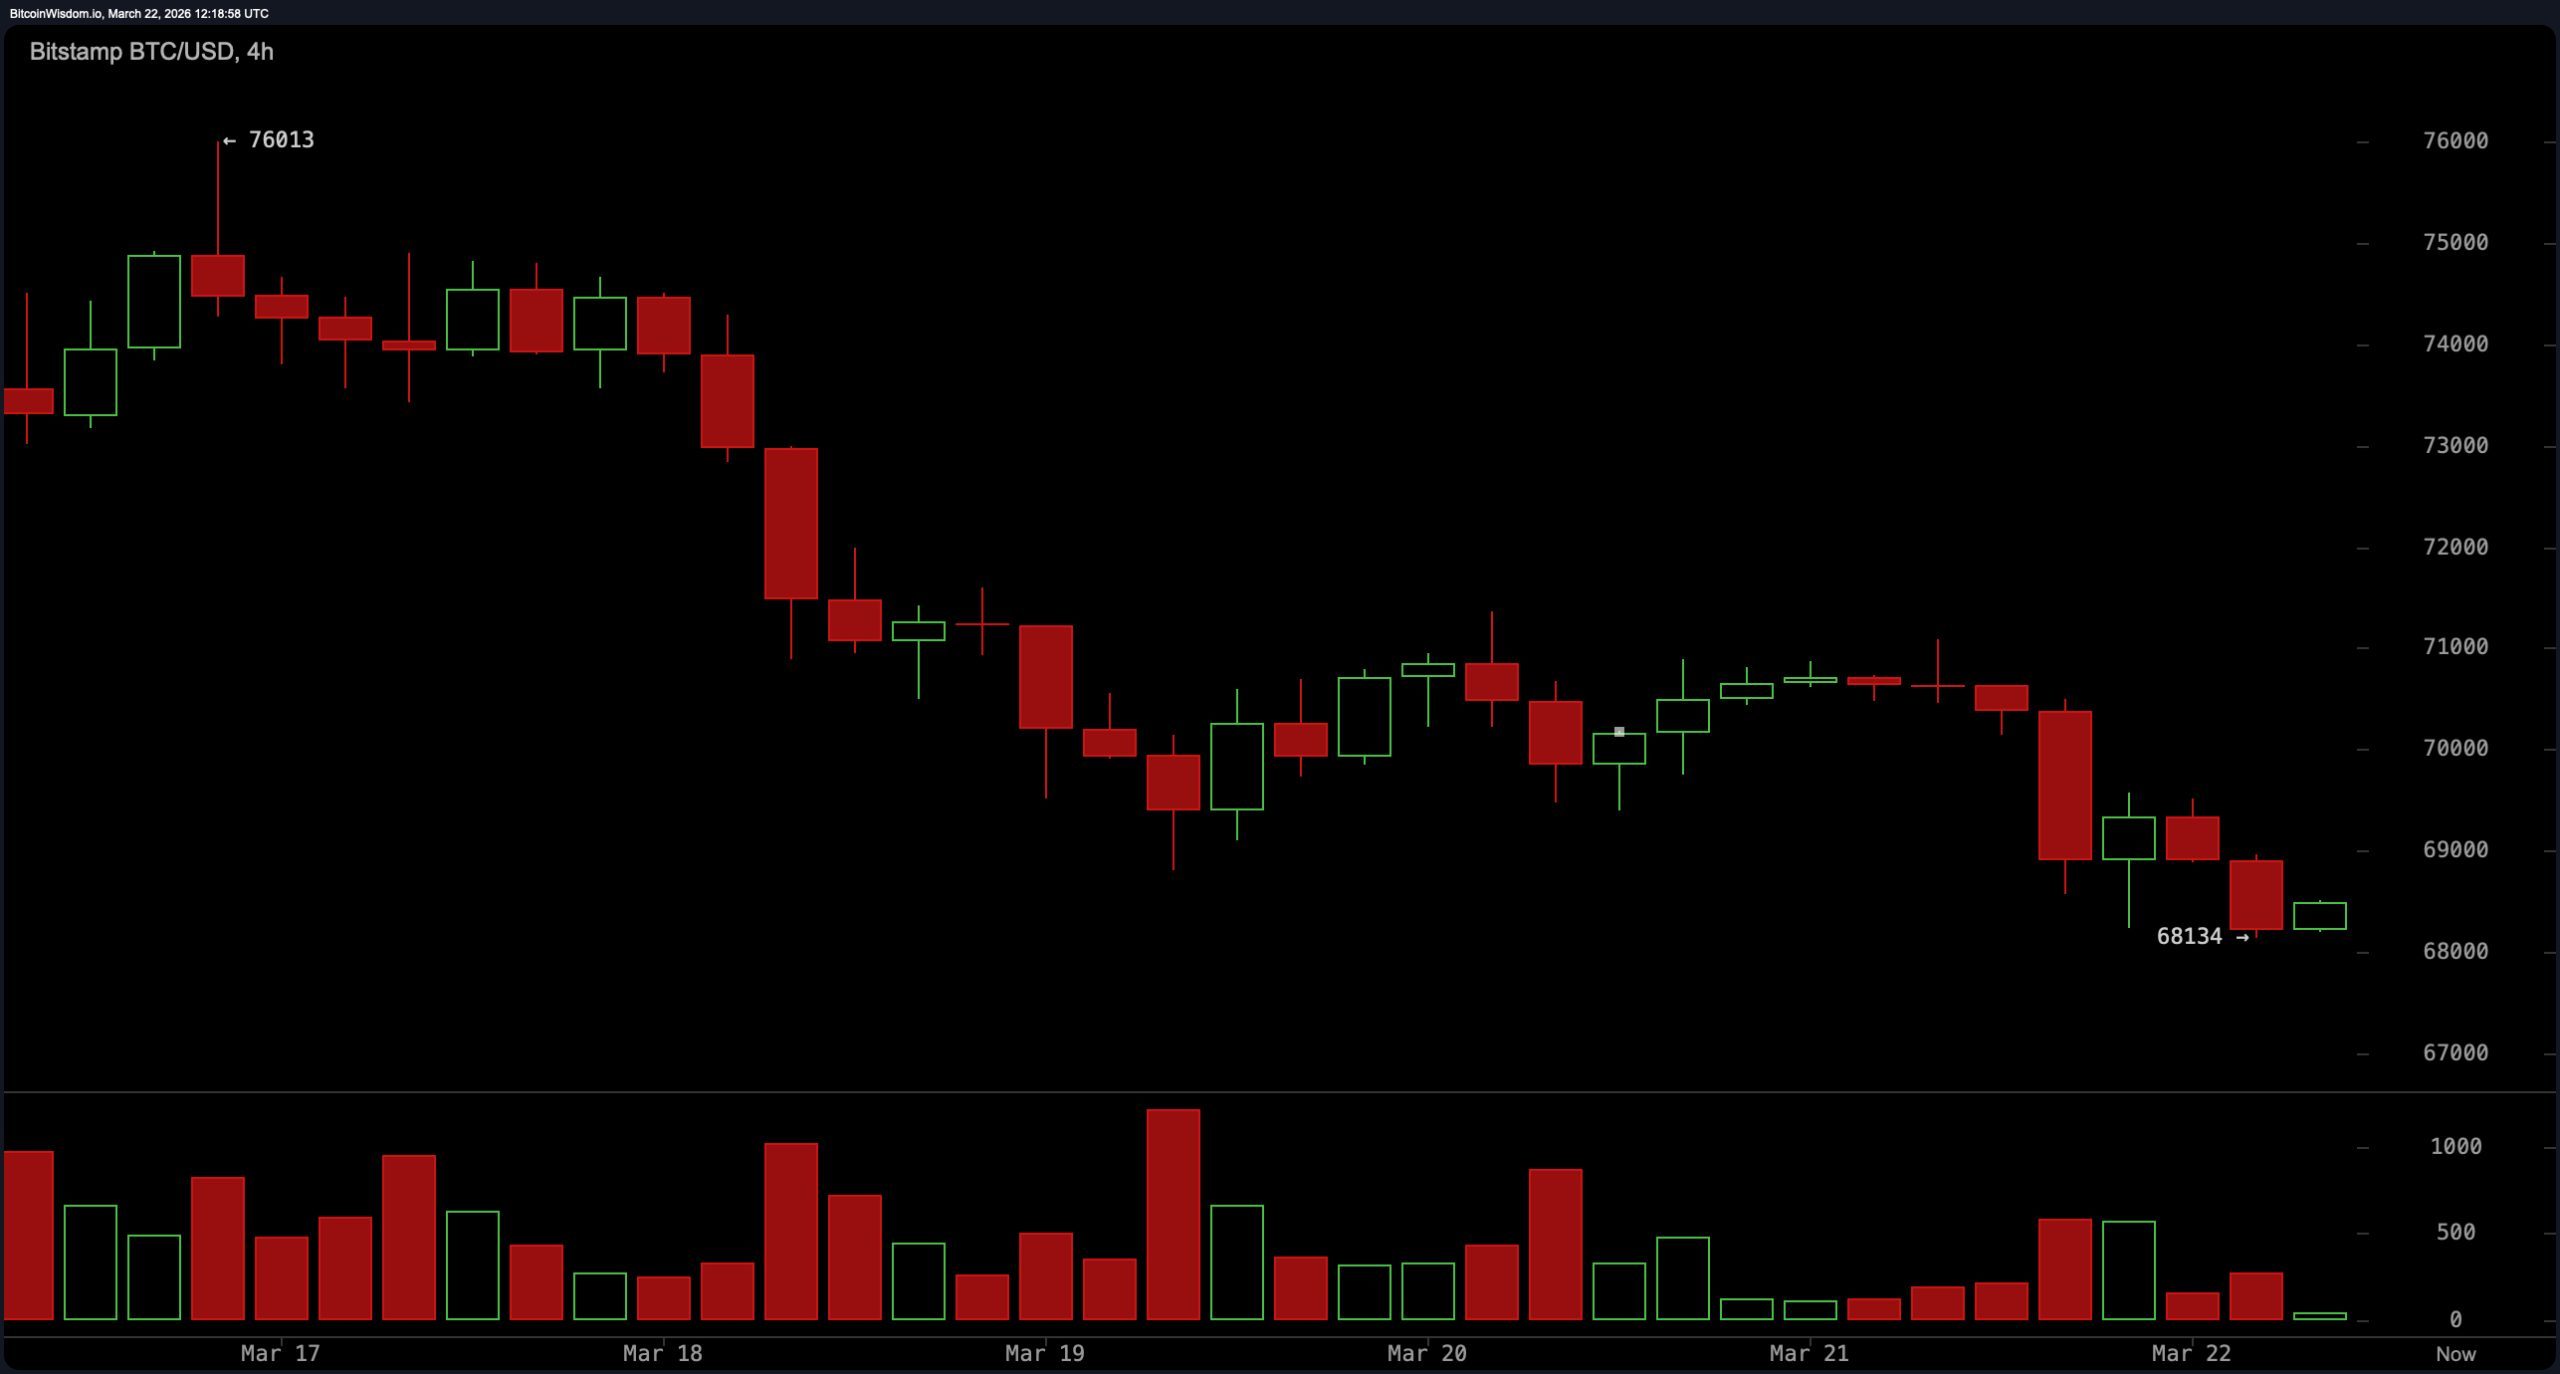
The four-hour bitcoin chart added a more cautious tone, with price forming lower highs and trading beneath short-term averages. This compression beneath resistance near $69,500 suggested sellers were quietly asserting control, even as price avoided a sharp breakdown. The structure indicated a gradual shift in sentiment, where rallies lacked follow-through and were met with consistent overhead pressure, reinforcing the idea of a market leaning defensive rather than expansive.
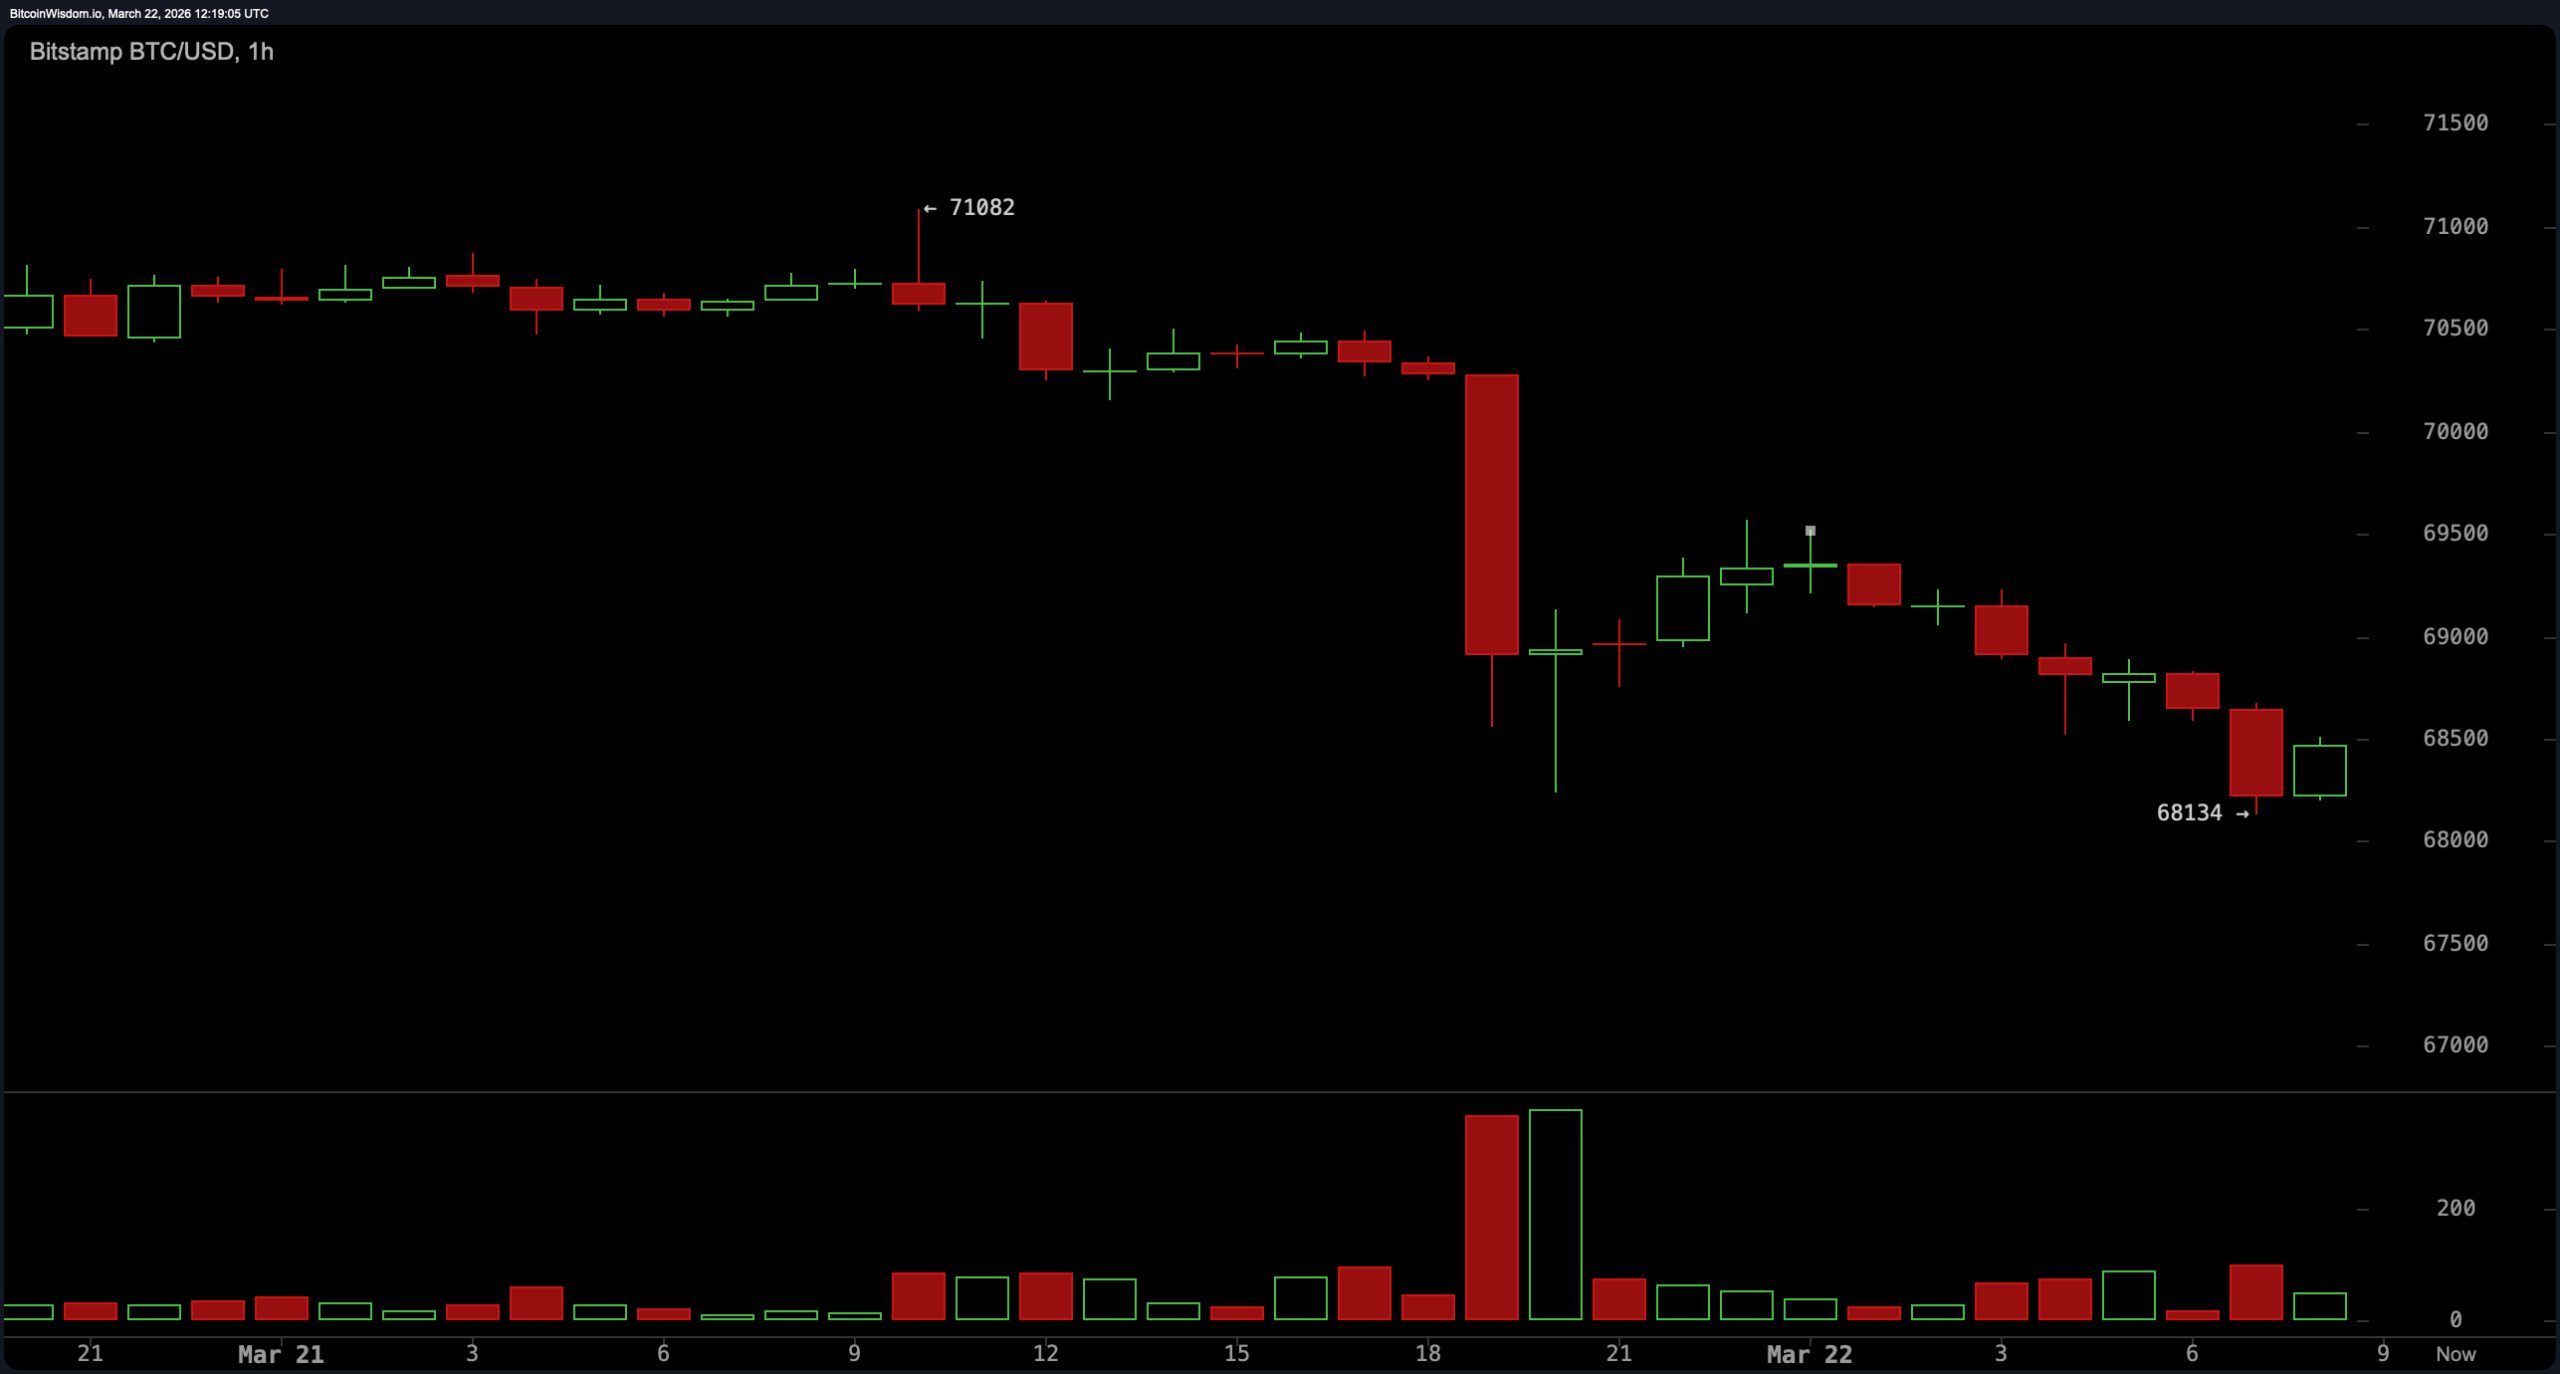
On the one-hour chart, bitcoin moved sideways within a tight band around $68,900, reflecting a market caught in short-term equilibrium. Order flow appeared balanced, with clustered trades between $68,925 and $68,959, underscoring a lack of urgency from either side. The muted reaction at this timeframe suggested that participants were waiting for a decisive move beyond immediate support or resistance before committing to directional exposure.
Oscillators painted a largely neutral picture, though not without subtle warning signs. The relative strength index ( RSI) at 45, stochastic oscillator at 35, commodity channel index (CCI) at negative 68, and average directional index (ADX) at 20 all indicated a market lacking strong trend conviction.
However, momentum registered negative 2,067 and the moving average convergence divergence ( MACD) level at 31 both signaled underlying weakness, hinting that bearish pressure was quietly building despite the broader neutral classification.
Moving averages (MAs) leaned decisively negative, offering perhaps the clearest directional bias in the dataset. The exponential moving average (EMA) and simple moving average (SMA) across nearly all periods—from the 10-day to the 200-day—sat above the current price, including the 10 EMA at $70,313 and 200 SMA at $92,573.
With 13 out of 15 moving averages signaling downward pressure, bitcoin remained structurally capped below key trend levels, reinforcing a market dynamic that looked less like accumulation and more like a pause under heavy ceilings.
Bull Verdict:
Bitcoin is holding the $68,200–$68,500 support zone despite sustained pressure from overhead moving averages, suggesting underlying demand has not fully evaporated. A decisive move above the $69,500–$70,000 region, paired with strengthening RSI and MACD signals, would shift momentum back in favor of upward continuation and signal that this consolidation phase was more reset than reversal.
Bear Verdict:
Bitcoin remains pinned below a dense cluster of declining moving averages, with weak momentum signals and repeated rejection near $70,000 reinforcing a ceiling that hasn’t cracked. A breakdown below $68,200 would expose the market to accelerated downside, confirming that the current range is less accumulation and more distribution dressed up as indecision.
FAQ 🔎
-
What is bitcoin’s price outlook for March 22, 2026?
Bitcoin shows a neutral-to-cautious outlook, with price consolidating near $68,000 under strong resistance. -
Why are bitcoin technical indicators signaling weakness?
Momentum and MACD indicators are negative, while most signals remain neutral, indicating fading strength. -
What key support and resistance levels are important for bitcoin?
Support sits near $68,200, while resistance remains heavy between $69,500 and $70,000. -
Are bitcoin moving averages bullish or bearish right now?
Most moving averages are above price, signaling continued downward pressure in the short to medium term.