Bitcoin is sending mixed signals as one chart shows a heavy no trade zone and another points to fading momentum. Together, they suggest the market may stay trapped until a stronger breakout or breakdown forces the next move.
Bitcoin URPD Shows Key No Trade Zone Between $65,636 and $70,685
The chart shared by Ali Charts uses Glassnode’s URPD, or UTXO Realized Price Distribution, to show where large amounts of Bitcoin last moved onchain. In this case, the most important cluster sits between $65,636 and $70,685, where more than 1.72 million BTC were transacted. That usually means many holders built positions in this range, making it a major battleground between buyers and sellers.
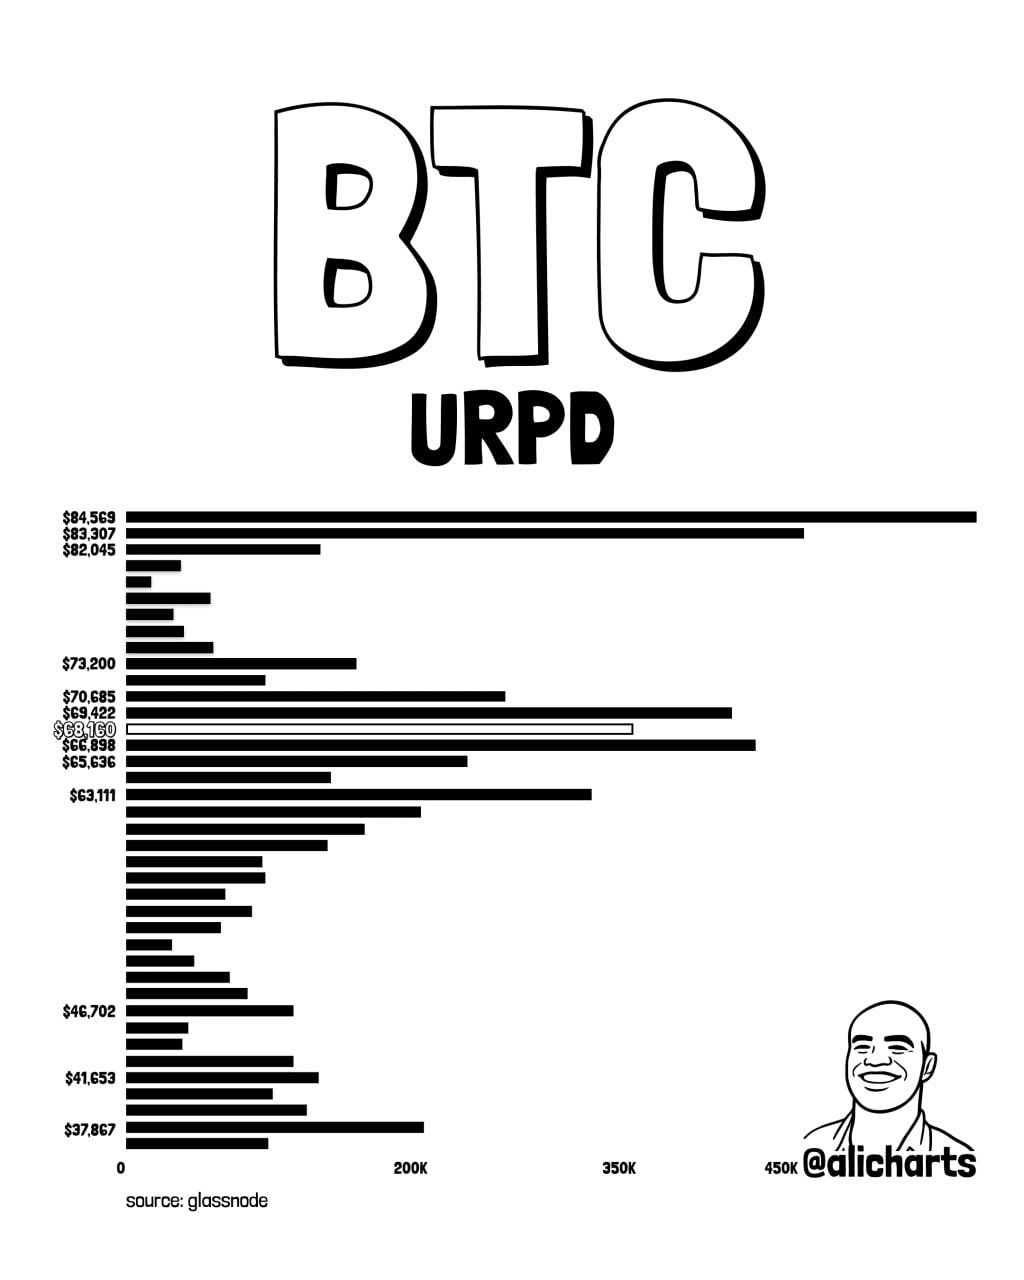
Bitcoin URPD No Trade Zone. Source: Ali Charts / Glassnode
The chart suggests Bitcoin is trading inside a heavy supply and demand zone rather than a clear trend area. When large volumes concentrate in one price band, that zone often acts as a strong support or resistance region depending on which side price approaches from. Therefore, as long as Bitcoin stays inside this band, price action may remain choppy and indecisive.
Ali Charts called this area a “No Trade Zone” because the next larger move may depend on a clean break from it. A push above $70,685 could show strength and open the door for a move toward higher realized supply clusters, including the areas near $73,200, $82,045, $83,307, and $84,569. On the other hand, a drop below $65,636 could weaken the current structure and shift focus toward lower support levels shown on the distribution map.
The broader message is that Bitcoin remains in a high interest price range where many market participants are already positioned. As a result, the chart points to consolidation rather than immediate trend confirmation. Until Bitcoin breaks above the upper boundary or falls below the lower one, the setup supports Ali Charts’ view that the market is still in a waiting phase.
Bitcoin RSI Uptrend Break Signals Fresh Weakness
The chart shared by Ted Pillows shows Bitcoin losing an RSI uptrend on the daily timeframe, a signal that may point to fading momentum after the recent rebound. The setup compares the current move to the pattern seen in January 2026, when momentum weakened before price moved lower.
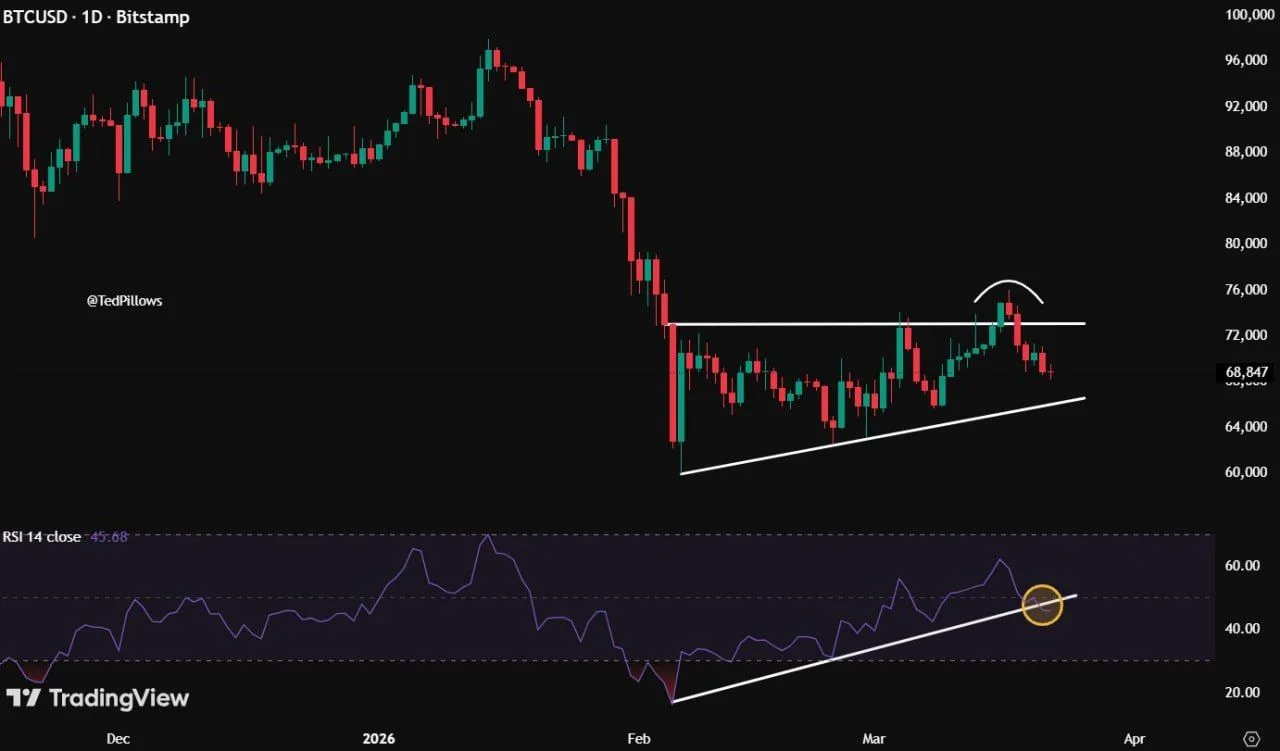
Bitcoin RSI Trendline Breakdown. Source: Ted Pillows
On the price chart, Bitcoin appears to have formed a rising structure from its February low, while recent candles show rejection near horizontal resistance around the low $70,000s. At the same time, the chart marks a rounded top near that resistance, suggesting buyers failed to push through a key ceiling.
The lower panel focuses on the 14 day RSI, where an upward sloping support line has now been broken. That matters because RSI trendline breaks often signal momentum deterioration before a larger directional move becomes clear on price alone. In this case, the loss of RSI support adds to the bearish tone of the broader setup.
Ted Pillows said the current chart “looks more like Jan 2026 again,” pointing to a possible repeat of the earlier pattern. While the comparison does not confirm the same outcome, it suggests the market may be entering another period of weakness rather than preparing for an immediate breakout.
For now, the chart shows a market that has lost momentum while struggling below resistance. Therefore, the RSI breakdown may remain a warning sign unless Bitcoin regains strength and reverses the recent weakness.