$BTC trades at $71,879 on April 8, pulling back slightly from a three-week high of $72,738 after the US and Iran agreed to a two-week ceasefire. All four EMAs still slope downward overhead, with the 20-day at $69,070 the only one reclaimed so far.
All Four EMAs Still Overhead
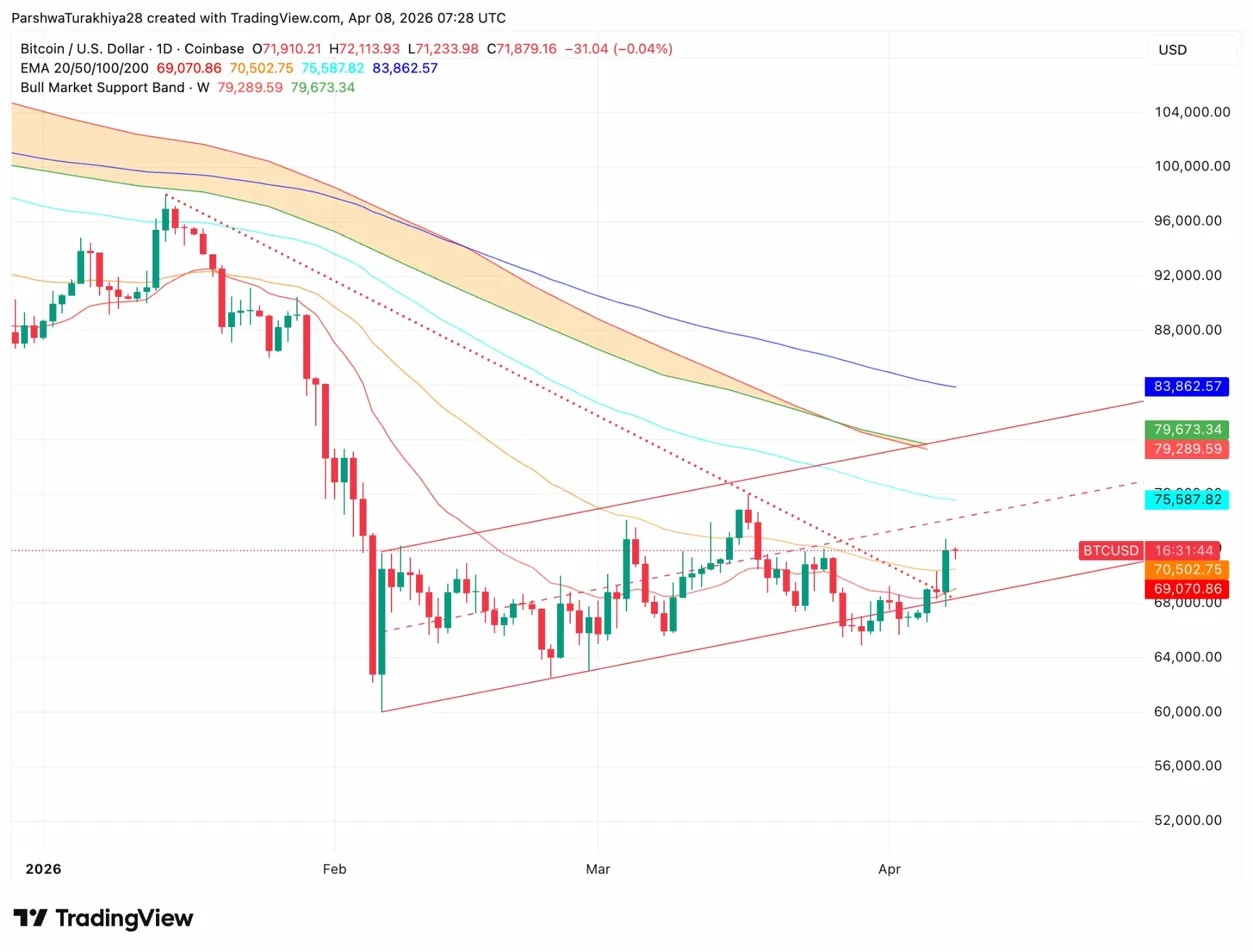
$BTC broke above the 20-day EMA at $69,070 and the 50-day EMA at $70,502 on today’s spike, but the 100-day at $75,587 and the 200-day at $83,862 remain well above price. The Bull Market Support Band sits between $79,289 and $79,673, marking the zone where this downtrend would need to reclaim before the daily structure turns bullish.
Related: Dogecoin Price Prediction: 99% Of Polymarket Bettors Pick DOGE To Close Green Today
The rally from the February low near $54,000 has built a series of higher lows through March, but each push higher has stalled before reaching the next EMA. Today’s candle tested $72,113 intraday before fading. A close above the 50-day at $70,502 would be the first sustained EMA reclaim since January, but the real test is the 100-day at $75,587, roughly 5% above current price.
Key levels for $BTC
- 20-day EMA: $69,070
- 50-day EMA: $70,502
- 100-day EMA: $75,587
- Bull Market Support Band: $79,289 to $79,673
- 200-day EMA: $83,862
The Ceasefire Spike
President Trump agreed to suspend bombing on Iran for two weeks, pushing crude oil lower and sending risk assets sharply higher. $BTC spiked 4.9% to $72,738 before settling near $71,879. Ether jumped as much as 7.4% to $2,273 on the same move.
The rally aligns with a shift in ETF flows. Spot Bitcoin ETFs drew $471.3M in net inflows on Monday, building on $22.3M the prior week. That reverses nearly $300M in outflows from the week before. March recorded roughly $1.3B in total net inflows, stabilizing after four straight months of outflows that started in November 2025. Institutional selling pressure is easing, but conviction buying has not returned at scale.
$215M In Short Liquidations
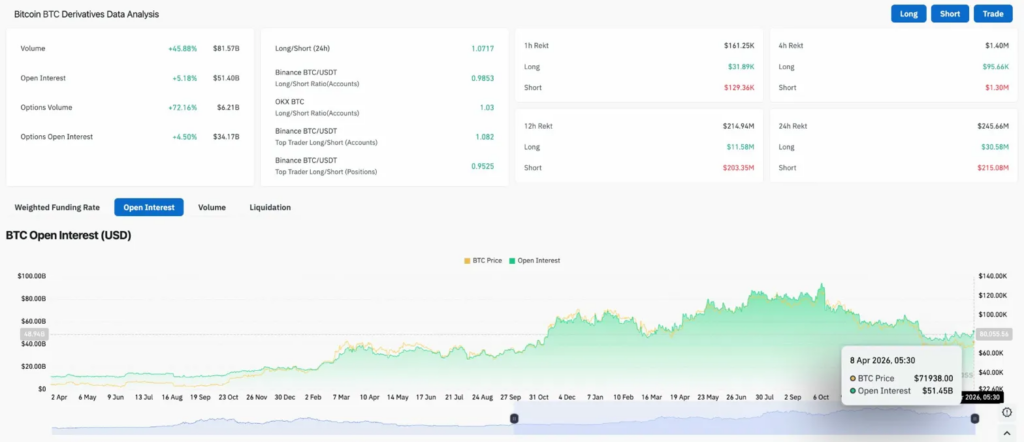
Volume jumped 45.88% to $81.57B while OI climbed 5.18% to $51.40B. Fresh money is entering on the back of the ceasefire spike. Options volume exploded 72.16% to $6.21B, with options OI up 4.50% to $34.17B.
Related: Zcash (ZEC) Price Prediction: Can Bulls Break the $329 Barrier?
The 24-hour long/short ratio sits at 1.0717, leaning slightly long. Over 24 hours, shorts lost $215.08M in liquidations against just $30.58M for longs. That 7-to-1 ratio confirms the ceasefire move was a genuine short squeeze. The 12-hour data tells the same story, with $203.35M in short liquidations versus $11.58M for longs. Sellers got caught badly on this one, and OI at $51.40B still has room to grow compared to the $80B+ peaks from late 2024.