Bitcoin is trading at $71,587 on Sunday morning with a market cap of $1.43 trillion and a 24-hour trading volume of $28.39 billion, moving within an intraday range of $71,484 to $73,720. The price drop followed comments from U.S. Vice President JD Vance, who disclosed that the United States failed to reach an agreement with Iran during peace talks with Pakistan. Technical conditions remain neutral overall, as short-term resilience meets stubborn higher-timeframe resistance in a market that seems undecided on its next move.
Key Takeaways:
- Bitcoin holds $71,587 on April 12, 2026, at 7:30 a.m. Eastern time; range-bound action signals weak trend strength.
- TradingView data shows RSI 56, ADX 16; neutral momentum limits breakout conviction.
- Bitcoin faces resistance near $73.5K; a break above $74K or below $70K sets the next move.
Bitcoin Chart Outlook
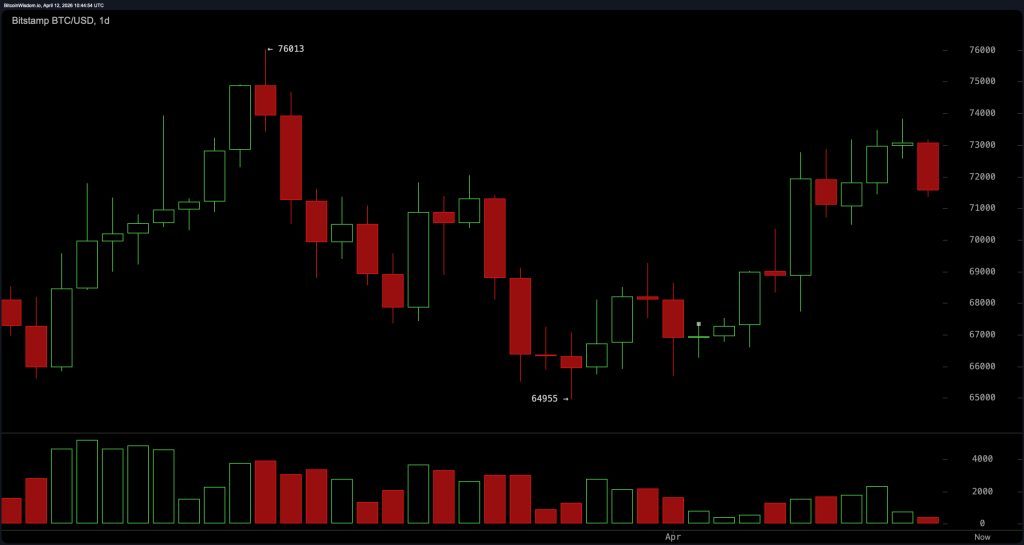
On the daily timeframe, bitcoin continues to trade within a well-defined range between approximately $65,000 and $76,000, with current price action pressing uncomfortably close to the upper boundary. Sitting near $72,000 to $73,000, the price is flirting with resistance rather than building a convincing breakout structure.
Momentum has slowed notably following the rebound from $65,000, suggesting that upward energy is losing steam. This positioning leaves bitcoin in a less-than-ideal spot, where upside is capped nearby while meaningful support sits several thousand dollars lower.
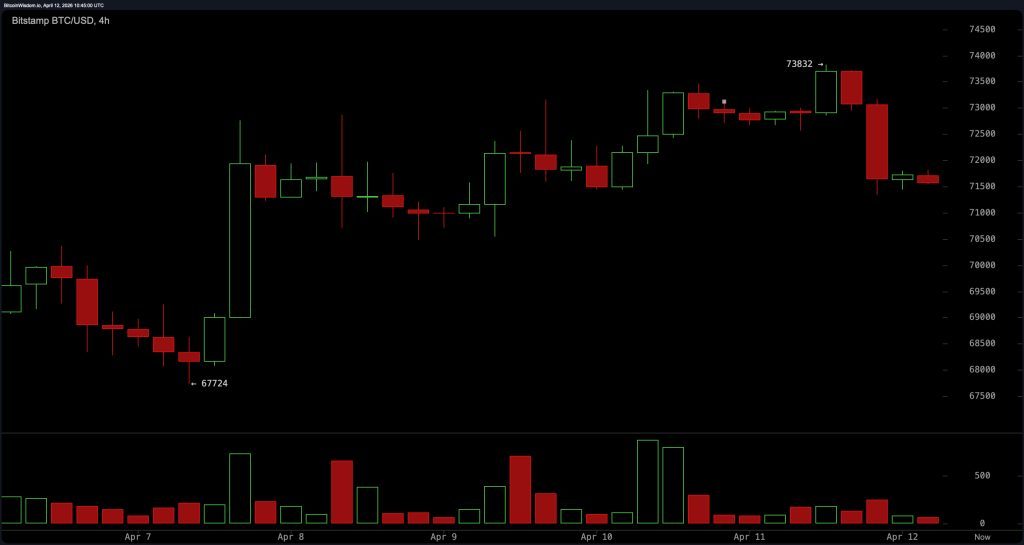
The four-hour chart introduces a more cautious tone, highlighted by a sharp rejection near $73,720 that produced a strong bearish candle. Since then, price structure has shifted into a pattern of lower highs, indicating short-term weakness creeping into the market. Resistance is now clearly defined between $72,500 and $73,500, while support rests between $70,500 and $71,000. A move below $70,000 would likely intensify downside momentum. For now, bitcoin appears to be navigating a corrective phase rather than building sustained directional strength.
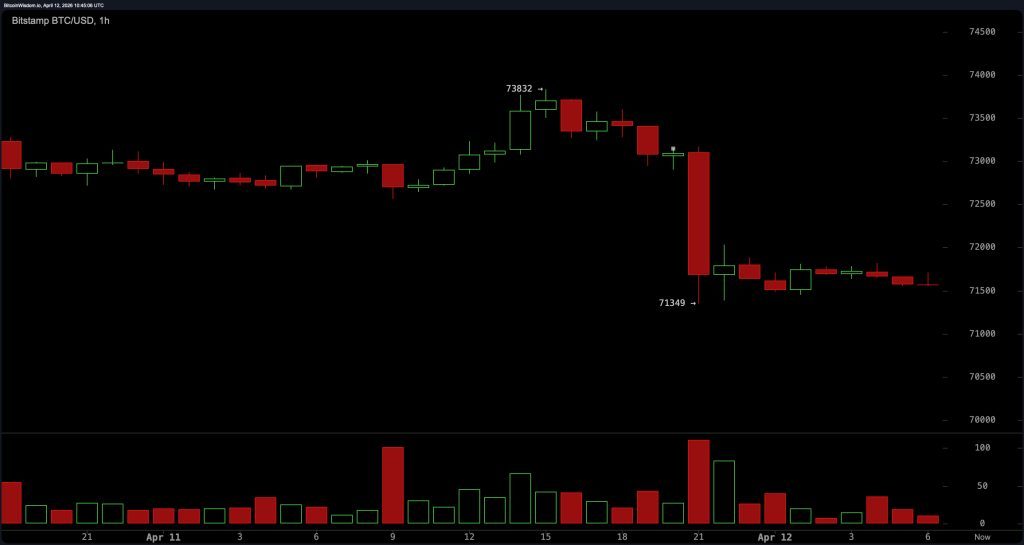
On the one-hour timeframe, bitcoin has settled into a narrow consolidation around $71,500 following a sharp drop. The subsequent bounce has been notably weak, reflecting a lack of aggressive participation from buyers. Intraday resistance is seen between $72,000 and $72,500, while support lies near $71,300 and extends down to $70,500. The range-bound behavior suggests equilibrium, but not the kind that inspires confidence—more of a stalemate than a setup for decisive movement.
Oscillators reinforce the broader theme of indecision, with the overall summary remaining neutral. The relative strength index ( RSI) at 56 reflects balanced conditions, while the Stochastic at 86 points toward overextended territory.
The commodity channel index (CCI) at 94 remains elevated yet neutral, and the average directional index (ADX) at 16 confirms weak trend strength. The Awesome oscillator at 2,351 stays neutral, while momentum (10) at 4,679 signals waning strength. The moving average convergence divergence ( MACD) (12, 26) level at 708 provides a rare constructive signal, though it stands somewhat alone in an otherwise mixed field.
The moving averages (MAs) summary also lands in neutral territory, but the details reveal a clear split. Short-term indicators are supportive, with the exponential moving average (EMA) (10) at $70,922 and simple moving average (SMA) (10) at $70,456 below the current price, alongside the EMA (20) at $70,102 and SMA (20) at $69,186. The EMA (30) at $69,953 and SMA (30) at $69,864, as well as the EMA (50) at $70,751 and SMA (50) at $69,170, reinforce this constructive tone. However, the longer-term picture is less forgiving, with the EMA (100) at $75,326 and SMA (100) at $75,466 above the price, followed by the EMA (200) at $83,405 and SMA (200) at $87,873. In plain terms, bitcoin has a short-term footing, but it is still staring up at a rather imposing ceiling.
Bull Verdict:
If bitcoin manages to reclaim and hold above the $73,500 to $74,000 region, it would invalidate the recent sequence of lower highs and reestablish upward momentum on the lower timeframes. Coupled with supportive short-term moving averages and a constructive moving average convergence divergence ( MACD), such a move could shift sentiment quickly and open the door toward retesting the upper boundary of the broader range near $76,000. In that scenario, this market stops hesitating and starts acting like it remembers its reputation.
Bear Verdict:
Failure to hold the $70,500 to $71,000 support zone, particularly a decisive break below $70,000, would confirm increasing downside pressure across multiple timeframes. With weak momentum, a high stochastic %K, and longer-term moving averages acting as overhead resistance, the path of least resistance could tilt lower toward the $69,000 to $70,000 region. At that point, bitcoin would no longer be indecisive—it would simply be giving up ground, one support level at a time.