Key takeaways
- $BTC is approaching $75,000 after adding nearly 5% to its value since Monday.
- The rally comes despite the ongoing crisis in the Middle East.
Bitcoin ($BTC) has stabilized above $74,000 as of Tuesday’s press time, following a 5% rally the previous day. This price surge comes as the US enforces a blockade on the Strait of Hormuz during ongoing peace talks with Iran. US Vice President JD Vance hints at a grand deal in the works, demanding an end to Iran’s nuclear ambitions.
Market sentiment recovers with $500M in liquidations
The broader cryptocurrency market is seeing a recovery, with over $500 million in liquidations across the last 24 hours, primarily driven by short squeezes. Aave (AAVE), Algorand (ALGO), and Ethereum (ETH) are leading the charge in the market’s upward momentum.
As negotiations between the US and Iran progress, the US military has started blocking the Strait of Hormuz, halting the movement of transiting ships. Vice President JD Vance emphasized that the situation is now in Iran’s hands, with the primary focus of US talks being Iran’s nuclear material exit and halting uranium enrichment. Former President Donald Trump also commented that “the other side” has approached him for a deal.
The peace talks appear to be fueling a “risk-on” sentiment, especially in the cryptocurrency market. According to CoinGlass data, the last 24 hours saw $531 million in liquidations, with $426 million attributed to short liquidations. This massive short squeeze indicates a major bearish wipeout.
Bitcoin is approaching key resistance levels
The $BTC/USD 4-hour chart remains bearish and efficient despite the recent rally. Bitcoin remains in a neutral-to-bullish trend, holding above its 50-day Exponential Moving Average (EMA) at $71,019. However, it is still capped below the 100-day EMA at $75,309.
Immediate resistance lies near the 100-day EMA and the 23.6% Fibonacci retracement level at $75,623, from a previous downtrend spanning $126,199 to $60,000. A daily close above this range would signal potential upward movement, with the next target being the 200-day EMA at $82,936, followed by the 50% Fibonacci retracement at $93,099.
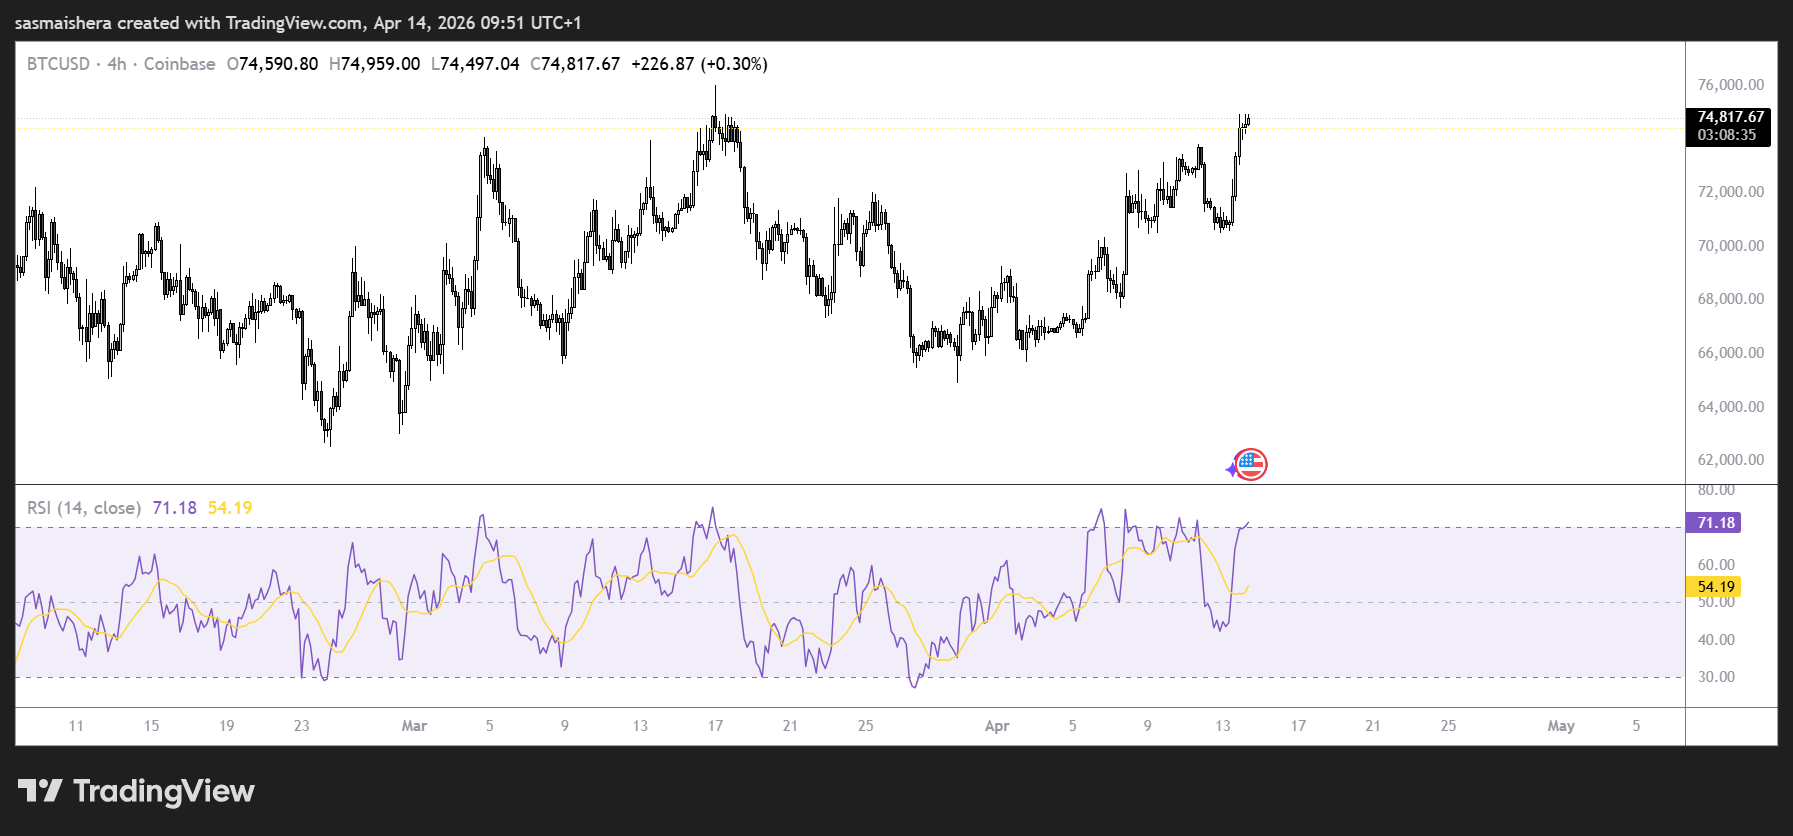
Market momentum is favoring the bulls, with the Relative Strength Index (RSI) at around 62 and the Moving Average Convergence Divergence (MACD) in positive territory, both suggesting upward pressure is gaining traction.
On the downside, Bitcoin’s initial support is found at the 50-day EMA around $71,019. A break below this support could weaken the current bullish momentum and push the price lower, potentially testing the Fibonacci support level near $60,000.