Skip to content
  • Home
  • Bitcoin
  • Business
  • Blockchain

Copyright the voice of money 2026 | Theme by ThemeinProgress | Proudly powered by WordPress

the voice of money
  • Home
  • Bitcoin
  • Business
  • Blockchain
Bitcoin Article

Analyst Conducts Technical Analysis on Bitcoin: Current Situation Resembles 2014 – Here’s What Happened Back Then

On April 14, 2026 by voice

Rekt Capital, a widely followed analyst in the cryptocurrency markets, has made noteworthy assessments regarding the technical outlook and possible scenarios following the recent rise in Bitcoin.

According to the analyst, when Bitcoin breaks downwards from “Macro Triangle” formations in past cycles, it generally tends to retrace towards a bear market bottom over time. However, the way this process works differs in each cycle. Rekt Capital points out that the price experienced rapid and sharp declines after these breakouts in 2018 and 2022, noting that the current cycle differs from these examples.

According to Rekt Capital, the current price movement closely resembles the 2014 cycle. During that period, Bitcoin experienced a long period of horizontal consolidation below the triangle formation. The analyst suggests that if a similar scenario continues, the Bitcoin price may move sideways for some time, with approximately $82,500 acting as a strong resistance (upper limit).

Related News Why Did the Bitcoin Price Go Up? Three Experts Explain the Reasons

On the other hand, the analyst adds that Bitcoin typically forms large consolidation zones following macro triangle breakouts. Recalling that in the 2018 and 2022 cycles these consolidations occurred directly at bear market bottoms, Rekt Capital notes that in 2014, two separate consolidation processes took place: the first after the breakout, and the second at the final bottom.

If this historical pattern repeats, the analyst suggests that the current consolidation process may not be complete yet, indicating that a further downward move in Bitcoin is possible and that the main strong consolidation zone could form later, near the bear market bottom.
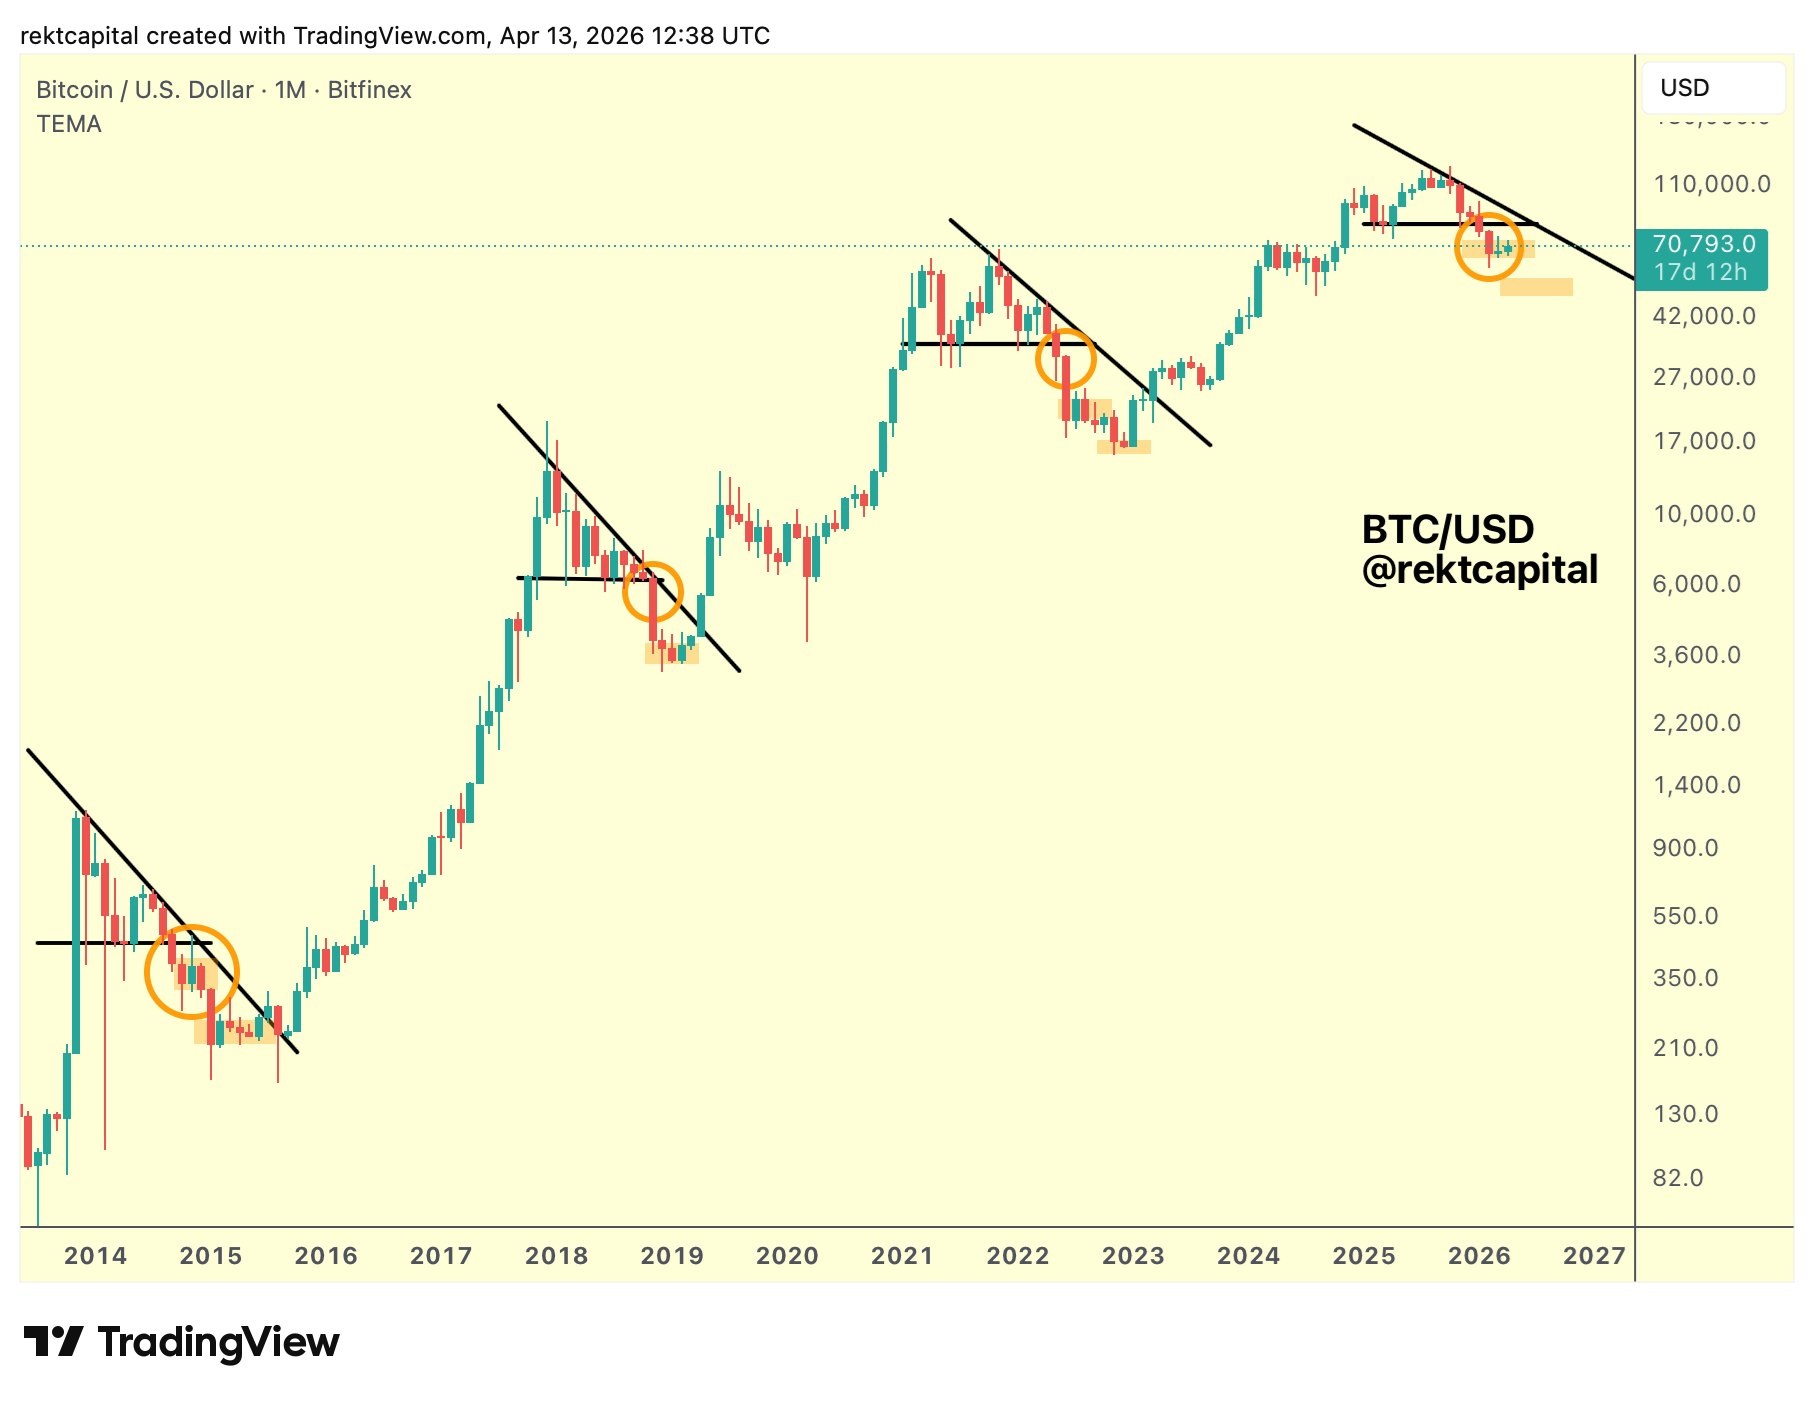
A chart shared by Rekt Capital showing macro triangle formations.

*This is not investment advice.

You may also like

BTC price prediction: BTC Bulls Regain Control as Brandt Backs Breakout Above $81K

Hedgeye Launches HBIT ETF With Options-Based Bitcoin Risk Strategy

Bitcoin price today stalls near $80,000 amid overbought warning signs

Archives

  • August 2026
  • July 2026
  • June 2026
  • May 2026
  • April 2026
  • March 2026
  • February 2026
  • January 2026
  • December 2025
  • November 2025
  • October 2025
  • September 2025
  • August 2025
  • July 2025
  • June 2025
  • May 2025
  • April 2025
  • March 2025
  • February 2025
  • January 2025
  • December 2024
  • November 2024
  • October 2024
  • September 2024
  • August 2024
  • July 2024
  • January 2024
  • December 2023
  • January 2023
  • December 2022
  • January 2022
  • December 2021
  • January 2021
  • December 2020
  • December 2019

Calendar

August 2026
M T W T F S S
 12
3456789
10111213141516
17181920212223
24252627282930
31  
« Jul    

Categories

  • AI
  • Bitcoin
  • Blockchain
  • Business
  • Markets

Archives

  • August 2026
  • July 2026
  • June 2026
  • May 2026
  • April 2026
  • March 2026
  • February 2026
  • January 2026
  • December 2025
  • November 2025
  • October 2025
  • September 2025
  • August 2025
  • July 2025
  • June 2025
  • May 2025
  • April 2025
  • March 2025
  • February 2025
  • January 2025
  • December 2024
  • November 2024
  • October 2024
  • September 2024
  • August 2024
  • July 2024
  • January 2024
  • December 2023
  • January 2023
  • December 2022
  • January 2022
  • December 2021
  • January 2021
  • December 2020
  • December 2019

Categories

  • AI
  • Bitcoin
  • Blockchain
  • Business
  • Markets

Copyright the voice of money 2026 | Theme by ThemeinProgress | Proudly powered by WordPress