The BCMI indicates that Bitcoin may now be close to a region that often translates to deep undervaluation.
Bitcoin has rebounded from its April 12 low of $70,500 to trade at $77,982, marking a 10% recovery. Amid the recent price action, Woominkyu, a verified analyst at CryptoQuant, pointed out that the Bitcoin Combined Market Index (BCMI) shows Bitcoin may be testing a historical pivot zone.
Key Points
- The BCMI suggests Bitcoin may be retesting a historical pivot zone.
- This index sits between 0.2 and 0.3, placing Bitcoin within a historically undervalued range.
- The SMA(90) is still trending downward, and only a flattening would confirm that selling pressure has eased.
- Bitcoin sees derivatives conditions that historically led to upward moves in over 80% of cases.
BCMI Shows Bitcoin Undervaluation
Woominkyu noted that the BCMI combines MVRV, NUPL, SOPR, and Fear & Greed indicators into a single reading. This makes it easier to understand overall market conditions, including profitability and sentiment. In general, higher values suggest the market may be overheating, while lower levels indicate undervaluation.
According to the analyst, the BCMI has dropped into the 0.2 to 0.3 range. Chart data places it at exactly 0.33. Earlier, on April 12, the index stood at 0.2969 when Bitcoin corrected to $70,500. While prices have since recovered, the index has only moved up gradually to 0.33.
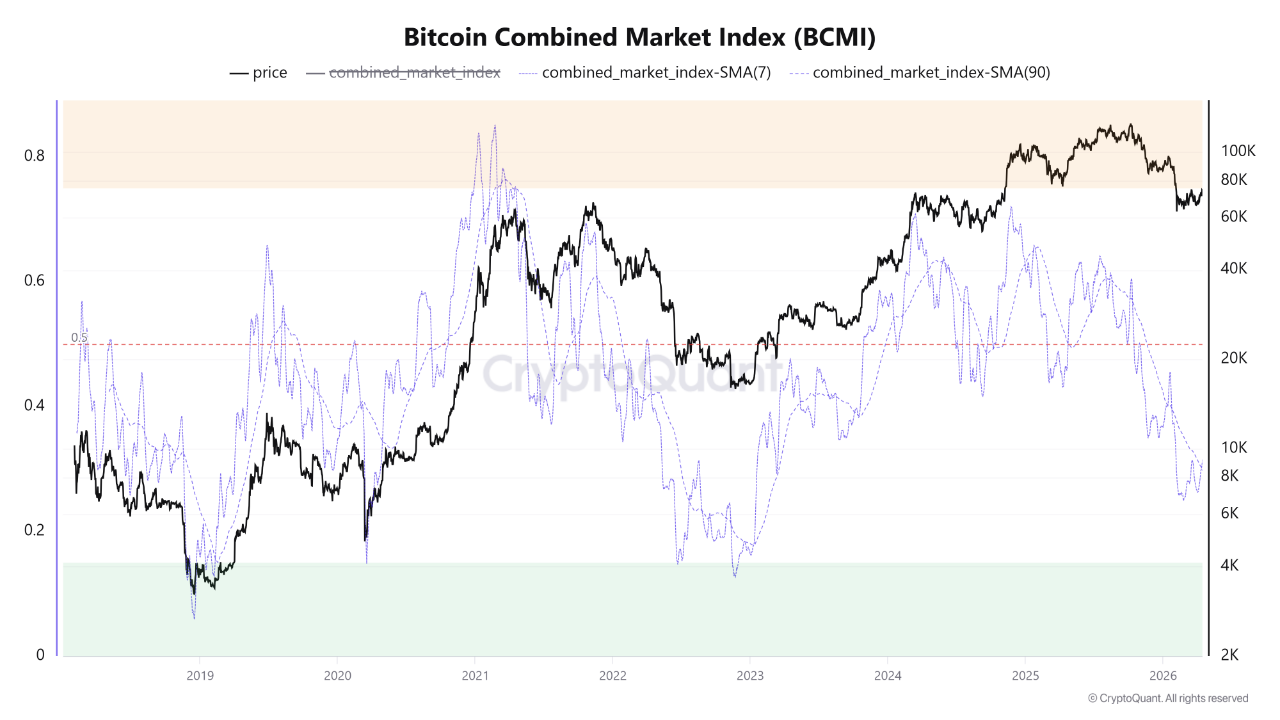
Woominkyu stressed that at the current position, Bitcoin is still within a zone that has historically been seen as undervalued. However, he clarified that this does not guarantee a quick V-shaped recovery, but it does indicate a level where Bitcoin has often found strong value.
Market Value and Sentiment at 2023 Levels
In addition, he stressed that the current figures involving the individual data points for the NUPL (25%) and the MVRV ratio (30%) show that the recent correction has reset market value and investor sentiment to levels last seen in early 2023.
At the moment, the MVRV ratio sits at 1.38, which suggests the market is in a healthy growth phase rather than being overvalued. The NUPL stands at 0.24, showing that investors are still holding moderate unrealized profits.
However, Woominkyu also pointed out that the SMA(90) line is still trending downward. He explained that this trend needs to flatten before traders can say that selling pressure has fully eased.
Where Next for Bitcoin?
Considering these signals, Woominkyu believes Bitcoin is entering what he calls a value-accumulation zone. In this phase, the downside risk appears to be more limited compared to the long-term upside.
However, he advised that traders remain cautious and wait for clearer signs of price stability before confirming that the market has reached a bottom.
Elsewhere, Michaël van de Poppe observed that Bitcoin funding rates have turned negative, while most options traders are holding put positions.
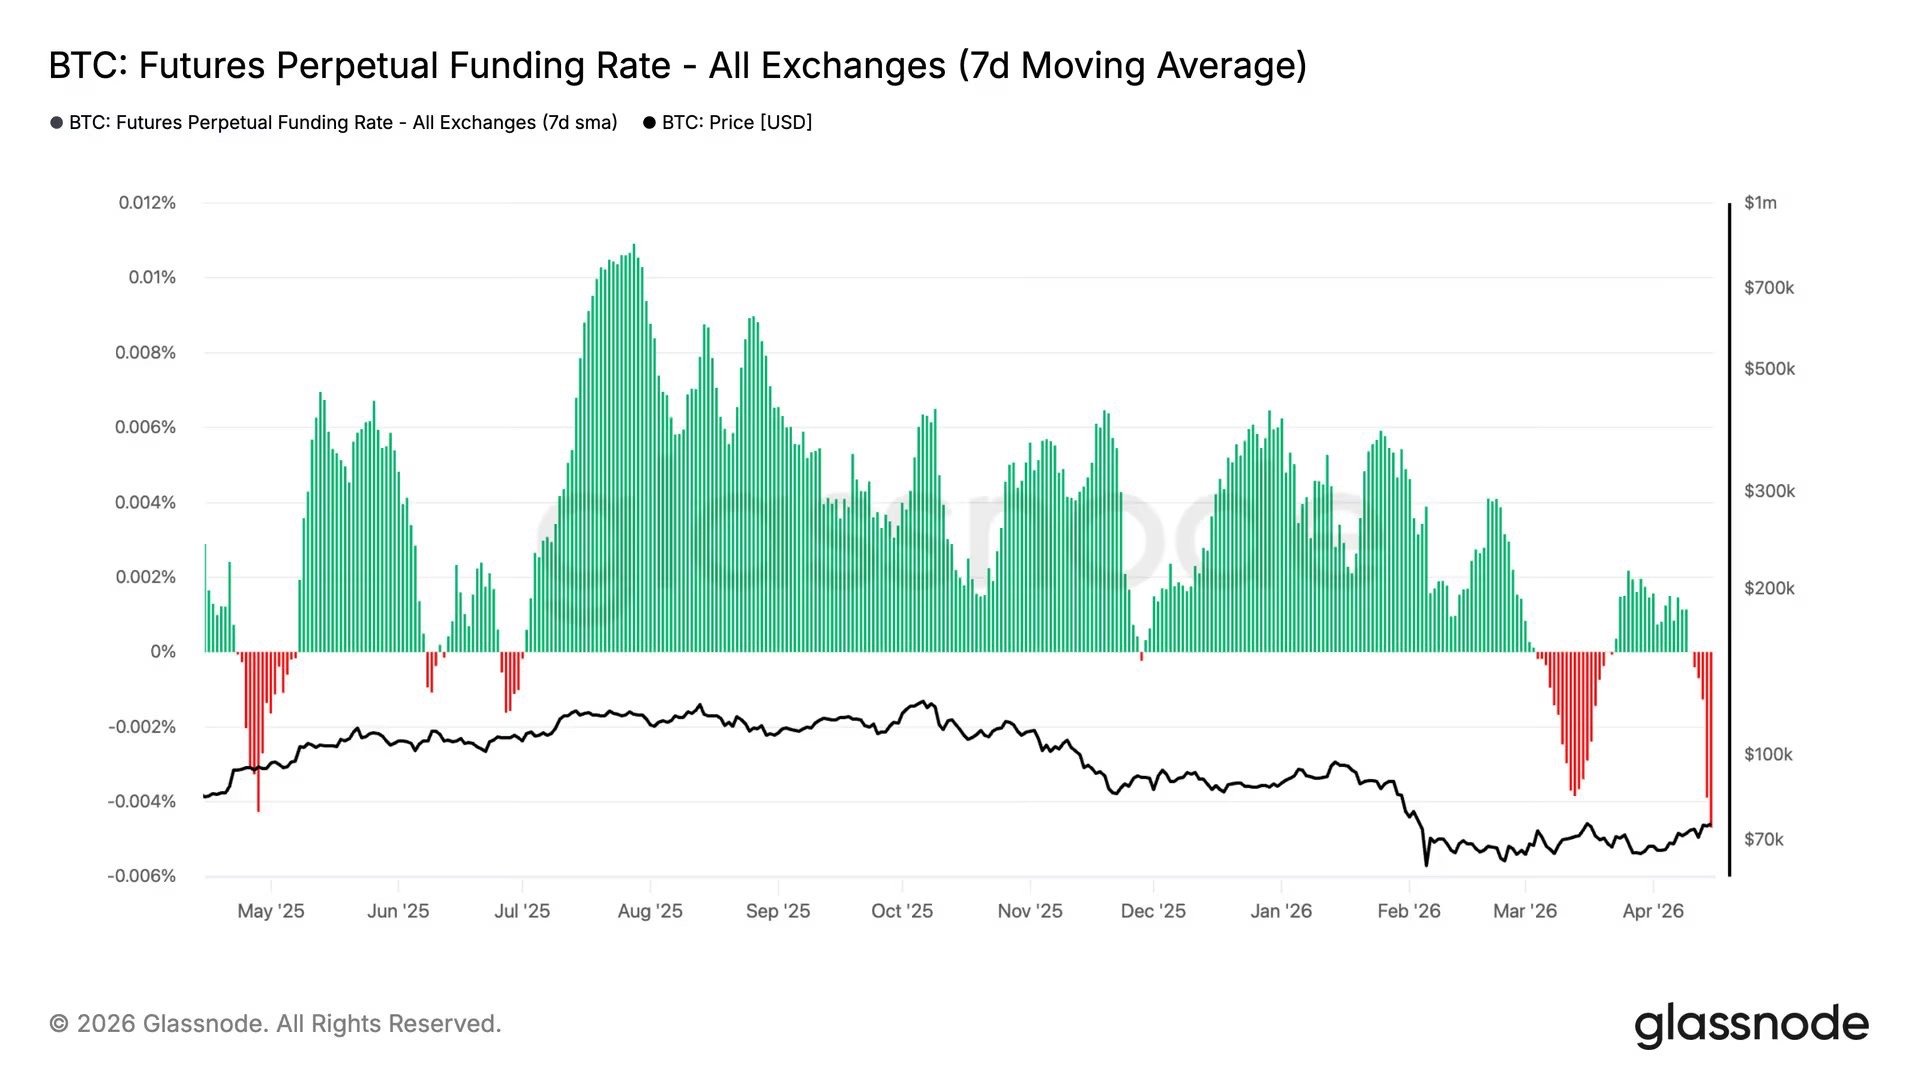
According to him, similar situations have happened before and, in more than 80% of those cases, the market moved upward afterward. These moves often led to a wave of short liquidations.
He also pointed out that Bitcoin is currently facing a resistance zone that many traders expect to hold and push prices lower. As a result, most traders are preparing for further downside.
However, this kind of one-sided expectation can sometimes lead to the opposite outcome. According to van de Poppe, when markets like the Nasdaq move higher, Bitcoin typically follows with stronger moves, and the current situation may not be different.