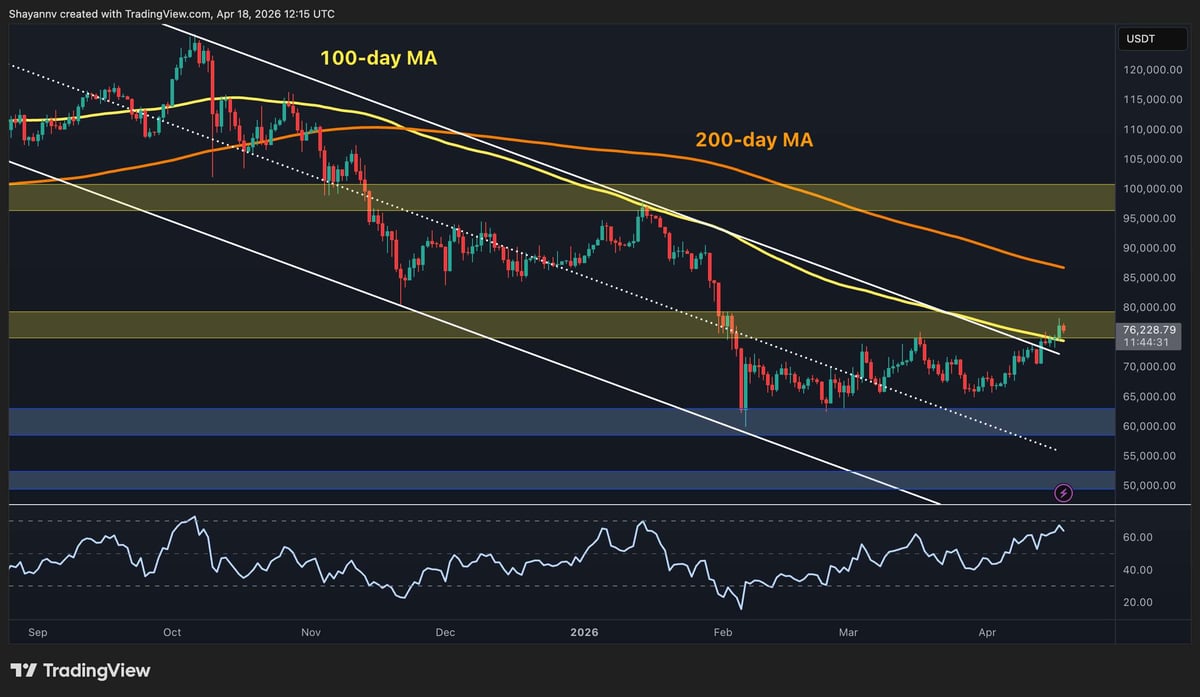
Bitcoin is trading around $76.2k, posting its highest price since the February crash and officially entering the $75k–$80k resistance band that has defined the ceiling of the recent consolidation. The move marks a meaningful escalation in the recovery, with $BTC now breaking above the descending channel and the 100-day MA simultaneously, which could be a very optimistic sign if sustained in the coming weeks.
Bitcoin Price Analysis: The Daily Chart
$BTC has broken decisively above both the descending channel’s upper boundary and the 100-day moving average (~$75k) on the daily chart. The RSI is now above 60, showing its highest reading since January when $BTC was trading around $95k. This is the most constructive daily setup over the past couple of months, and for the first time, the technical weight of evidence is beginning to tilt in favor of buyers rather than simply suggesting seller exhaustion.
The immediate focus shifts to whether $BTC can close above the $75k–$80k resistance zone and establish it as a support level. This zone can serve as a key floor for the upcoming months, and reclaiming it on a sustained basis would be a significant structural development. Above it, the 200-day MA (~$86k–$87k) and the $95k–$100k critical supply zone represent the next major obstacles. On the downside, the channel’s former upper boundary can be counted on for a retest and bounce, with the $60k area as the deeper floor.
$BTC/USDT 4-Hour Chart
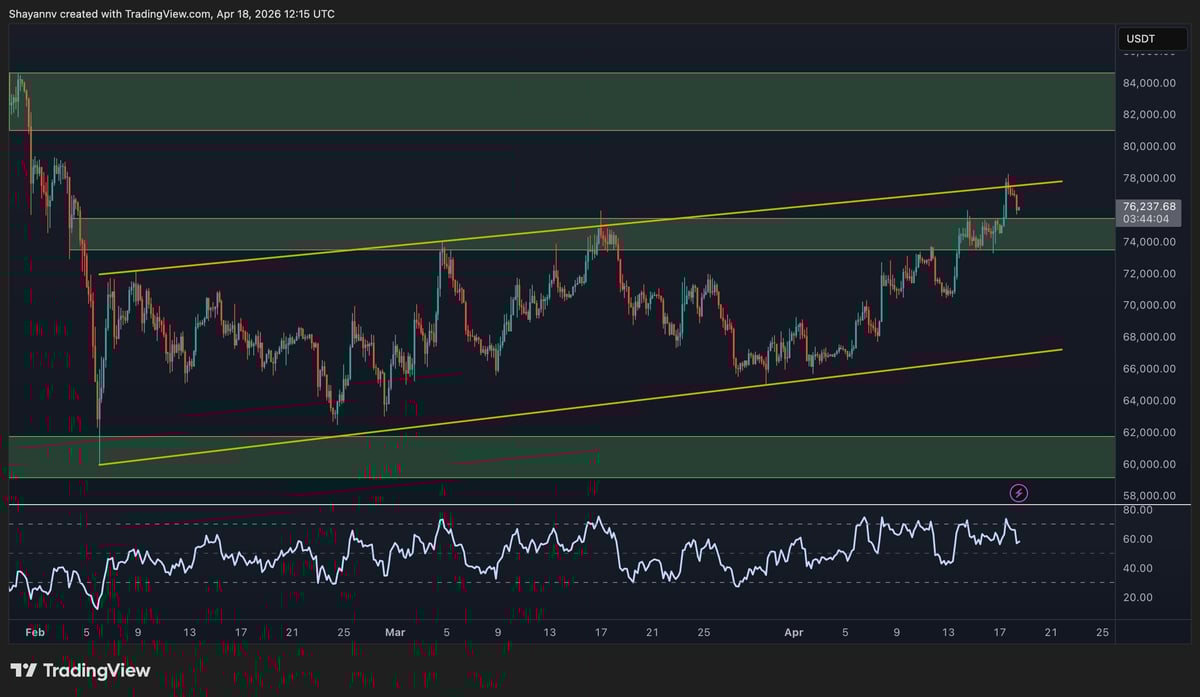
On the 4-hour chart, $BTC has briefly pushed through the upper boundary of the ascending channel earlier in the week, tagging the $78k mark before falling back inside the channel. The price is now sitting just below the upper boundary, which is a pattern that often reflects a short-term consolidation or correction following a failed breakout.
The RSI on this timeframe has also pulled back from the overbought region but is not yet signaling a trend reversal. A consolidation above $74k–$75k followed by a renewed push would be the ideal structure for buyers. A breakdown back below the recent structural low near $74k, however, would be more concerning and would warrant reassessment of the short-term outlook, as it points to a probable bearish market shift on the 4-hour timeframe.
On-Chain Analysis
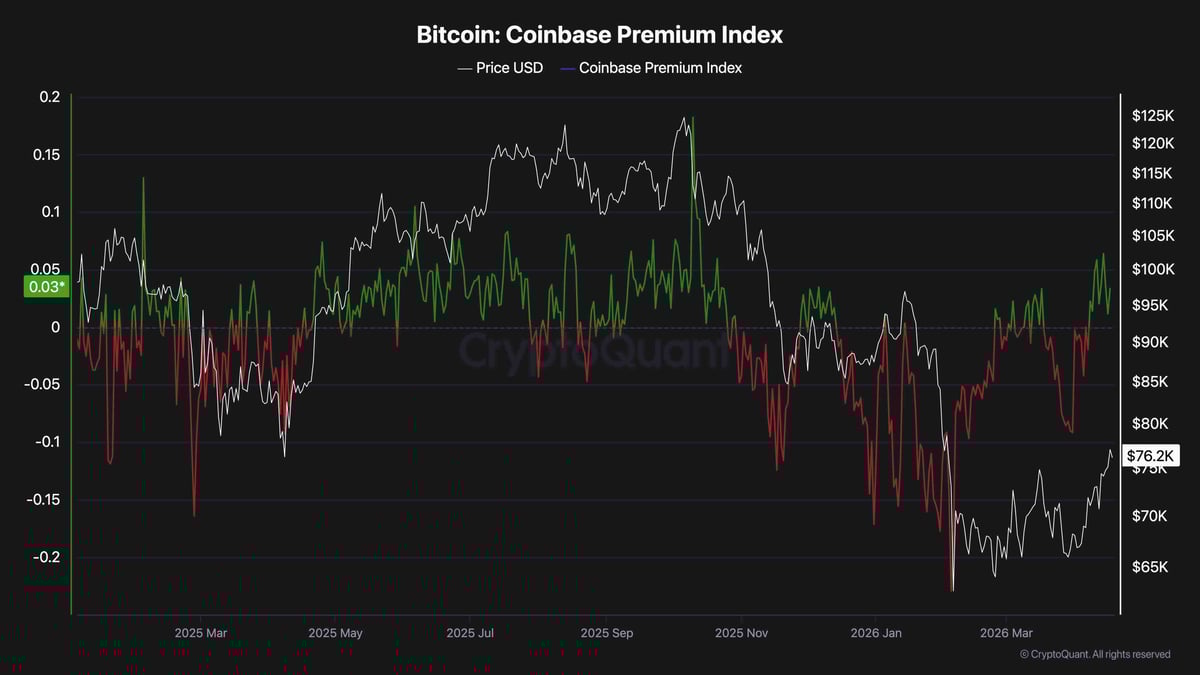
The Bitcoin Coinbase Premium Index has flipped convincingly into positive territory, currently reading around +0.03. This is the first notable positive reading since the correction accelerated in late 2025. After months of deep negative prints that characterized the February crash period, where the index plunged toward -0.20, the shift to green reflects a meaningful change in the behavior of US-based buyers on Coinbase.
The timing aligns precisely with $BTC’s breakout above the descending channel, suggesting the move is being supported by genuine US demand rather than purely driven by offshore or derivatives activity. During the 2025 bull run, the Coinbase Premium remained consistently positive throughout the rally.
While one week of positive readings does not recreate that dynamic, the directional shift is notable. If the premium continues to strengthen and hold above zero as price pushes into the $75k–$80k resistance band, it would add meaningful conviction to the case that this recovery has institutional backing rather than being purely technically driven.