Bitcoin is closing out April at $76k, ending the month exactly where the technical battle lines are drawn. The recovery from the February low near $60k has been orderly rather than explosive, and after a late push toward $80k failed to sustain, $BTC has pulled back to retest the structures that matter most heading into May. Beneath that consolidation, the futures order flow is telling a story the price chart alone does not fully capture.
Bitcoin Price Analysis: The Daily Chart
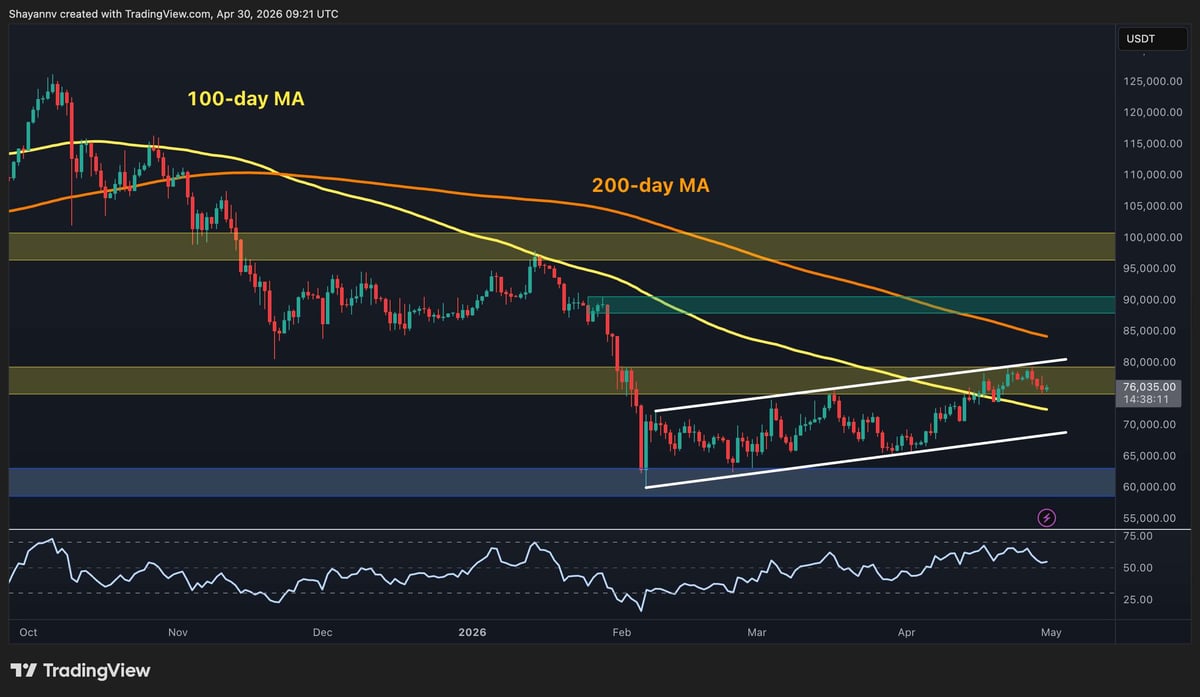
From the February low, Bitcoin has carved out a clean ascending channel with the lower boundary now providing support near $70k. The price is now likely to test the declining 100-day moving average around $72k after the rejection from the higher boundary of the channel and the $80k resistance level. The RSI is also hovering around 50–55, fading slightly from the mid-April peak as it reflects a market that is consolidating rather than reversing.
The ascending channel structure remains intact as long as $75k holds on a daily close. A bounce from here that reclaims $80k would keep the recovery thesis firmly on track and set up a test of the 200-day moving average around $85k and potentially the $90k supply zone. On the other hand, a drop below the channel floor on a closing basis would be a significant structural damage that would shift focus back toward the $60k demand zone near the February low.
$BTC/USDT 4-Hour Chart
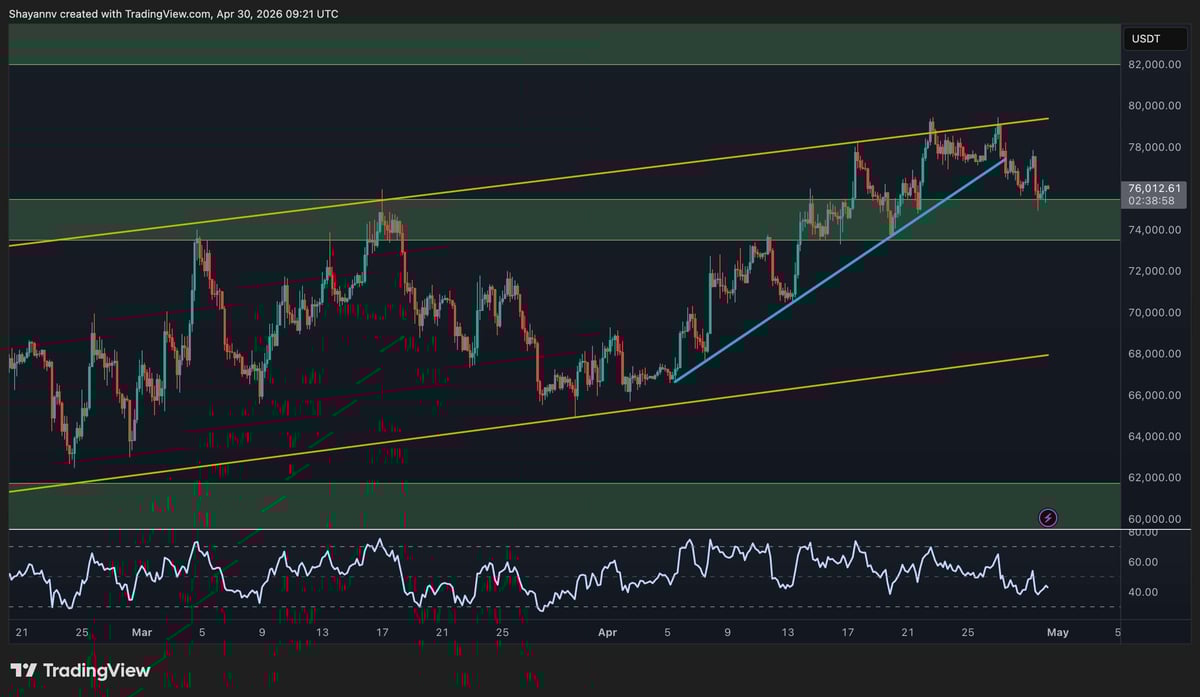
On the 4-hour chart, the steeper blue trendline that defined the sharpest leg of April’s rally has been broken, and the price has pulled back from the $80k upper channel boundary to sit just above the $76k green support zone. The RSI on this timeframe has dropped to around 40, which is the softest reading over the past week, signaling that short-term momentum has genuinely weakened and buyers cannot take the current support level for granted.
The broader ascending channel from the early April lows remains intact, with its lower boundary tracking near $68k, which is still well below the current price. This means the larger structure has not been threatened. What has changed is the texture of the move, as the inner trendline loss suggests the easy, low-resistance part of the April rally is over.
A clean hold of the $74k–75k support zone and a clear bounce from this level would signal that the pullback is corrective and the next leg toward $80k is building. However, failure to hold $74k opens the mid-channel area near $72k as the next logical support, followed by the lower boundary of the channel at $68k.
Sentiment Analysis
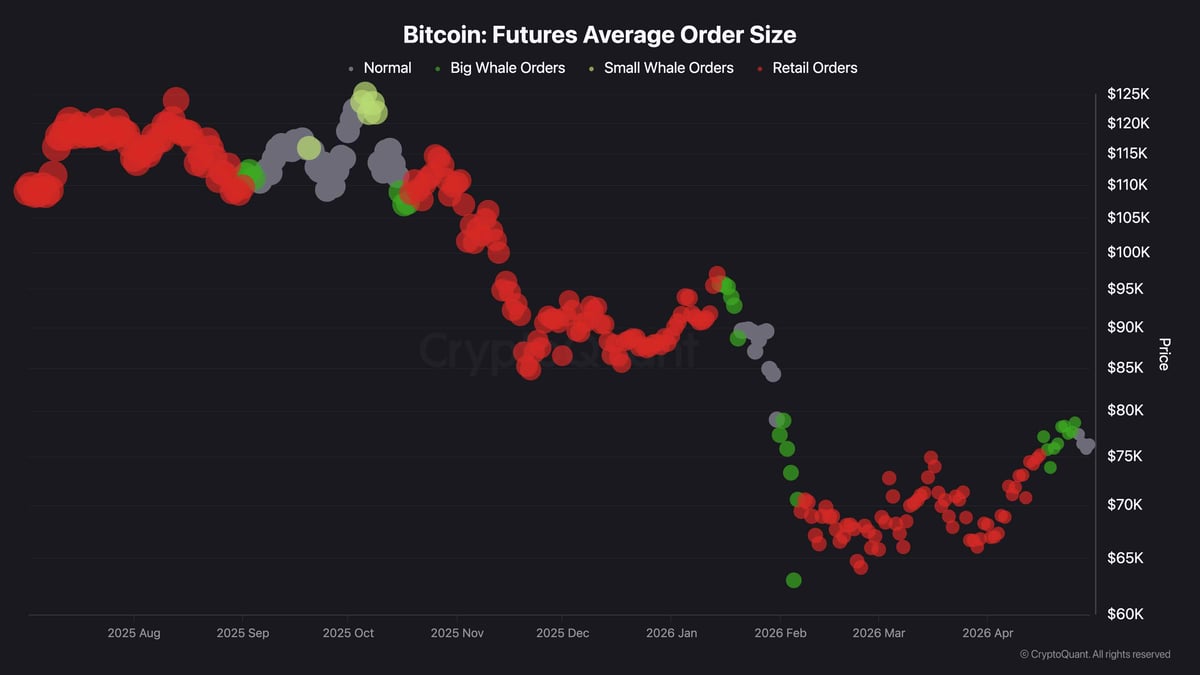
Throughout the entire corrective phase from late 2025 to March 2026, Bitcoin’s futures market was dominated almost exclusively by retail-sized orders, as the red dots blanket the price chart from $110k all the way down to $62k. This reflects a correction driven and sustained by smaller participants capitulating in a declining market. The first meaningful shift came near the February low, when a cluster of large whale futures orders appeared, which was the first institutional-scale futures activity in months.
What is happening in April is a continuation and amplification of that signal. A fresh cluster of big whale futures orders is now forming near the $75k zone and is growing in density over the past two weeks alongside the current consolidation. Unlike the spot accumulation data seen earlier in the cycle, these are leveraged positions. Whales are not just quietly buying the dip in spot markets. They are also expressing directional conviction through futures.
That distinction matters, as it implies a higher-conviction bet on upside from current levels, or even hedging behavior to tackle their spot portfolio’s downside risk. As a result, if the $75k level holds as the floor, the futures order flow suggests the next significant move is more likely up toward the $80k and beyond than a continuation of the correction.