Bitcoin is pushing into a key resistance zone after its strongest daily close in three months.
However, $BTC still needs a clean breakout above trendline resistance and RSI pressure to confirm stronger momentum.
Bitcoin RSI Keeps Breakout Unconfirmed
Bitcoin traded near $80,470 on the 1 day BTCUSDT perpetual chart shared by Elja. The chart shows $BTC recovering from its February low, but price has not confirmed a breakout above the rising resistance line.
$BTC moved from the lower $60,000 area toward the $80,000 zone during the recent recovery. However, the latest candle sits near the trendline, where Bitcoin still needs a clean daily close above resistance.
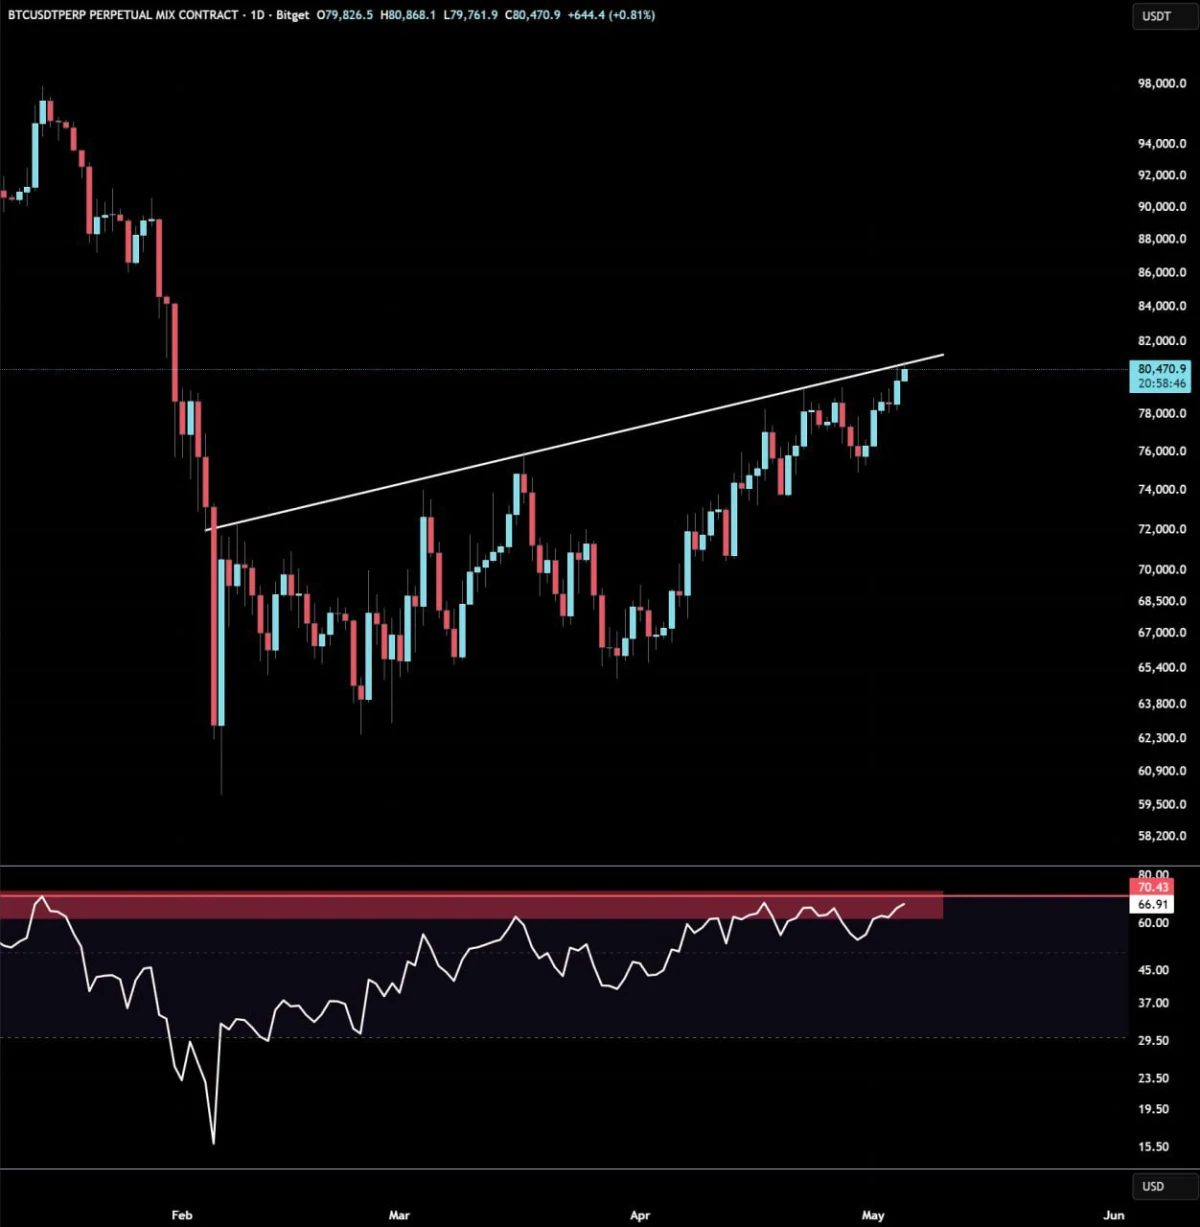
Bitcoin RSI Resistance Chart. Source: Elja on X
The RSI also shows pressure near the upper resistance zone. It stood around 66.91, while the red resistance area sits near the 70 level. That means momentum has improved, but it has not entered a clear breakout phase yet.
Elja said Bitcoin is still struggling against RSI resistance. The chart supports that view because the RSI has tested the same upper zone several times without a strong move above it.
This setup matters because price and RSI are both near key resistance areas. If Bitcoin breaks above the trendline while RSI moves above the red zone, buyers would get stronger confirmation.
For now, the chart shows Bitcoin in a recovery phase, not a confirmed breakout. $BTC needs stronger momentum above both price resistance and RSI resistance to change the structure. Until then, the $80,000 area remains the main level to watch.
Bitcoin Hits Three Month Closing High as $BTC Tests Trendline Resistance
Bitcoin reached its highest daily close in three months, according to the $BTC daily chart shared by Super฿ro. The chart shows $BTC recovering from the February selloff and pressing into a rising diagonal resistance area near the low $80,000 range.
The move followed a steady rebound from the lower $60,000 area in late February and March. Since then, Bitcoin has printed a sequence of higher lows and higher highs, showing stronger short term momentum.
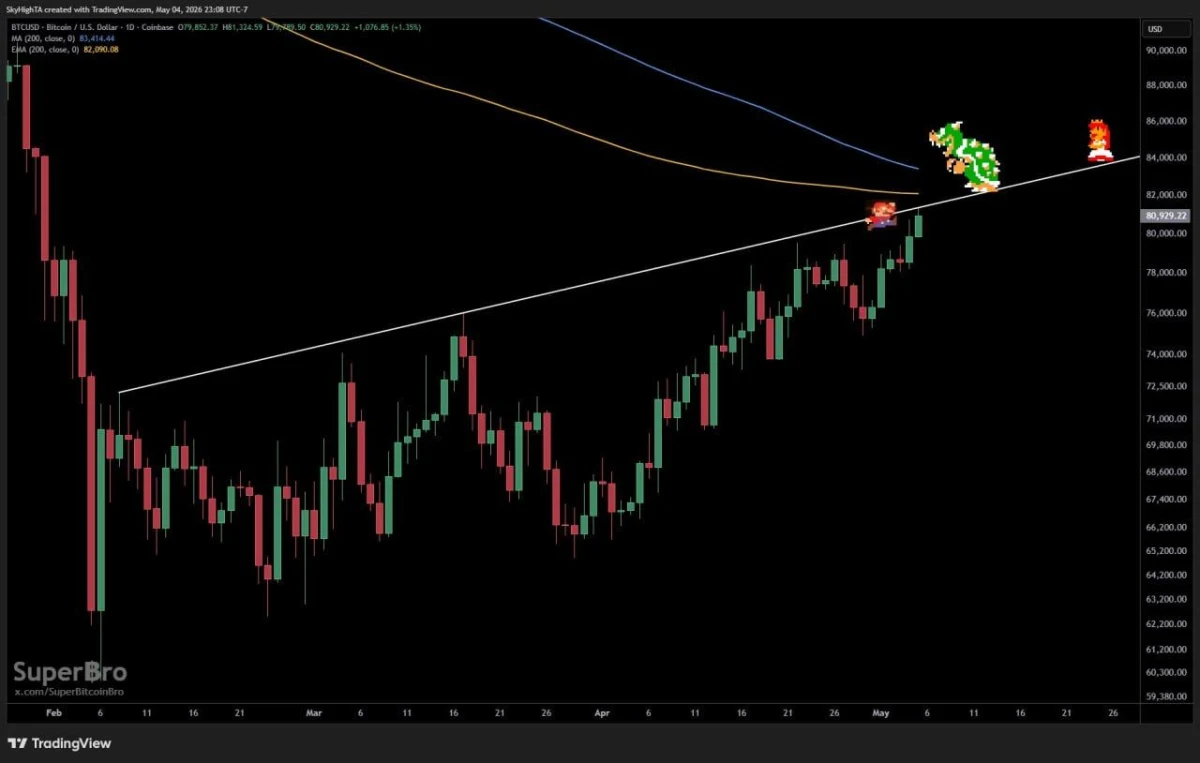
Bitcoin Three Month Closing High Chart. Source: Super฿ro on X
However, $BTC is now testing an important resistance zone. The white trendline on the chart sits just above the latest candles, while the 200 day moving average also appears near the same area. That makes the current region important for confirmation.
Super฿ro also pointed to more than $1 billion in spot Bitcoin ETF inflows over the last two days. Strong ETF inflows can support market demand because they show fresh capital entering Bitcoin products.
Still, the chart does not show a confirmed breakout yet. $BTC needs a clean daily close above the trendline and the nearby moving average area to strengthen the bullish setup.
If Bitcoin clears this resistance, the next area to watch sits around the mid $80,000 range. If it fails, price could retest the recent breakout area near $78,000 to $80,000 before another attempt higher.