
A group of technical analysts has convinced themselves that the price of bitcoin (BTC) strongly correlates with M2 money, yet their compelling charts decorrelate on even the simplest zoom modification.
Of course, the narrative of BTC — set in stone since Satoshi Nakamoto’s genesis block inscription about bank bailouts — is that BTC should displace fiat.
Motivated to find data supporting this narrative, technicians discovered M2, overlaid it atop BTC, and published screenshots to social media.
Technical analysts chart prices and trading volumes in an attempt to find predictive signals. According to some investors, the global stock of money, as measured by a 100-day offset M2, is a strong signal for the price of BTC.
This particular comparison has become popular on X.
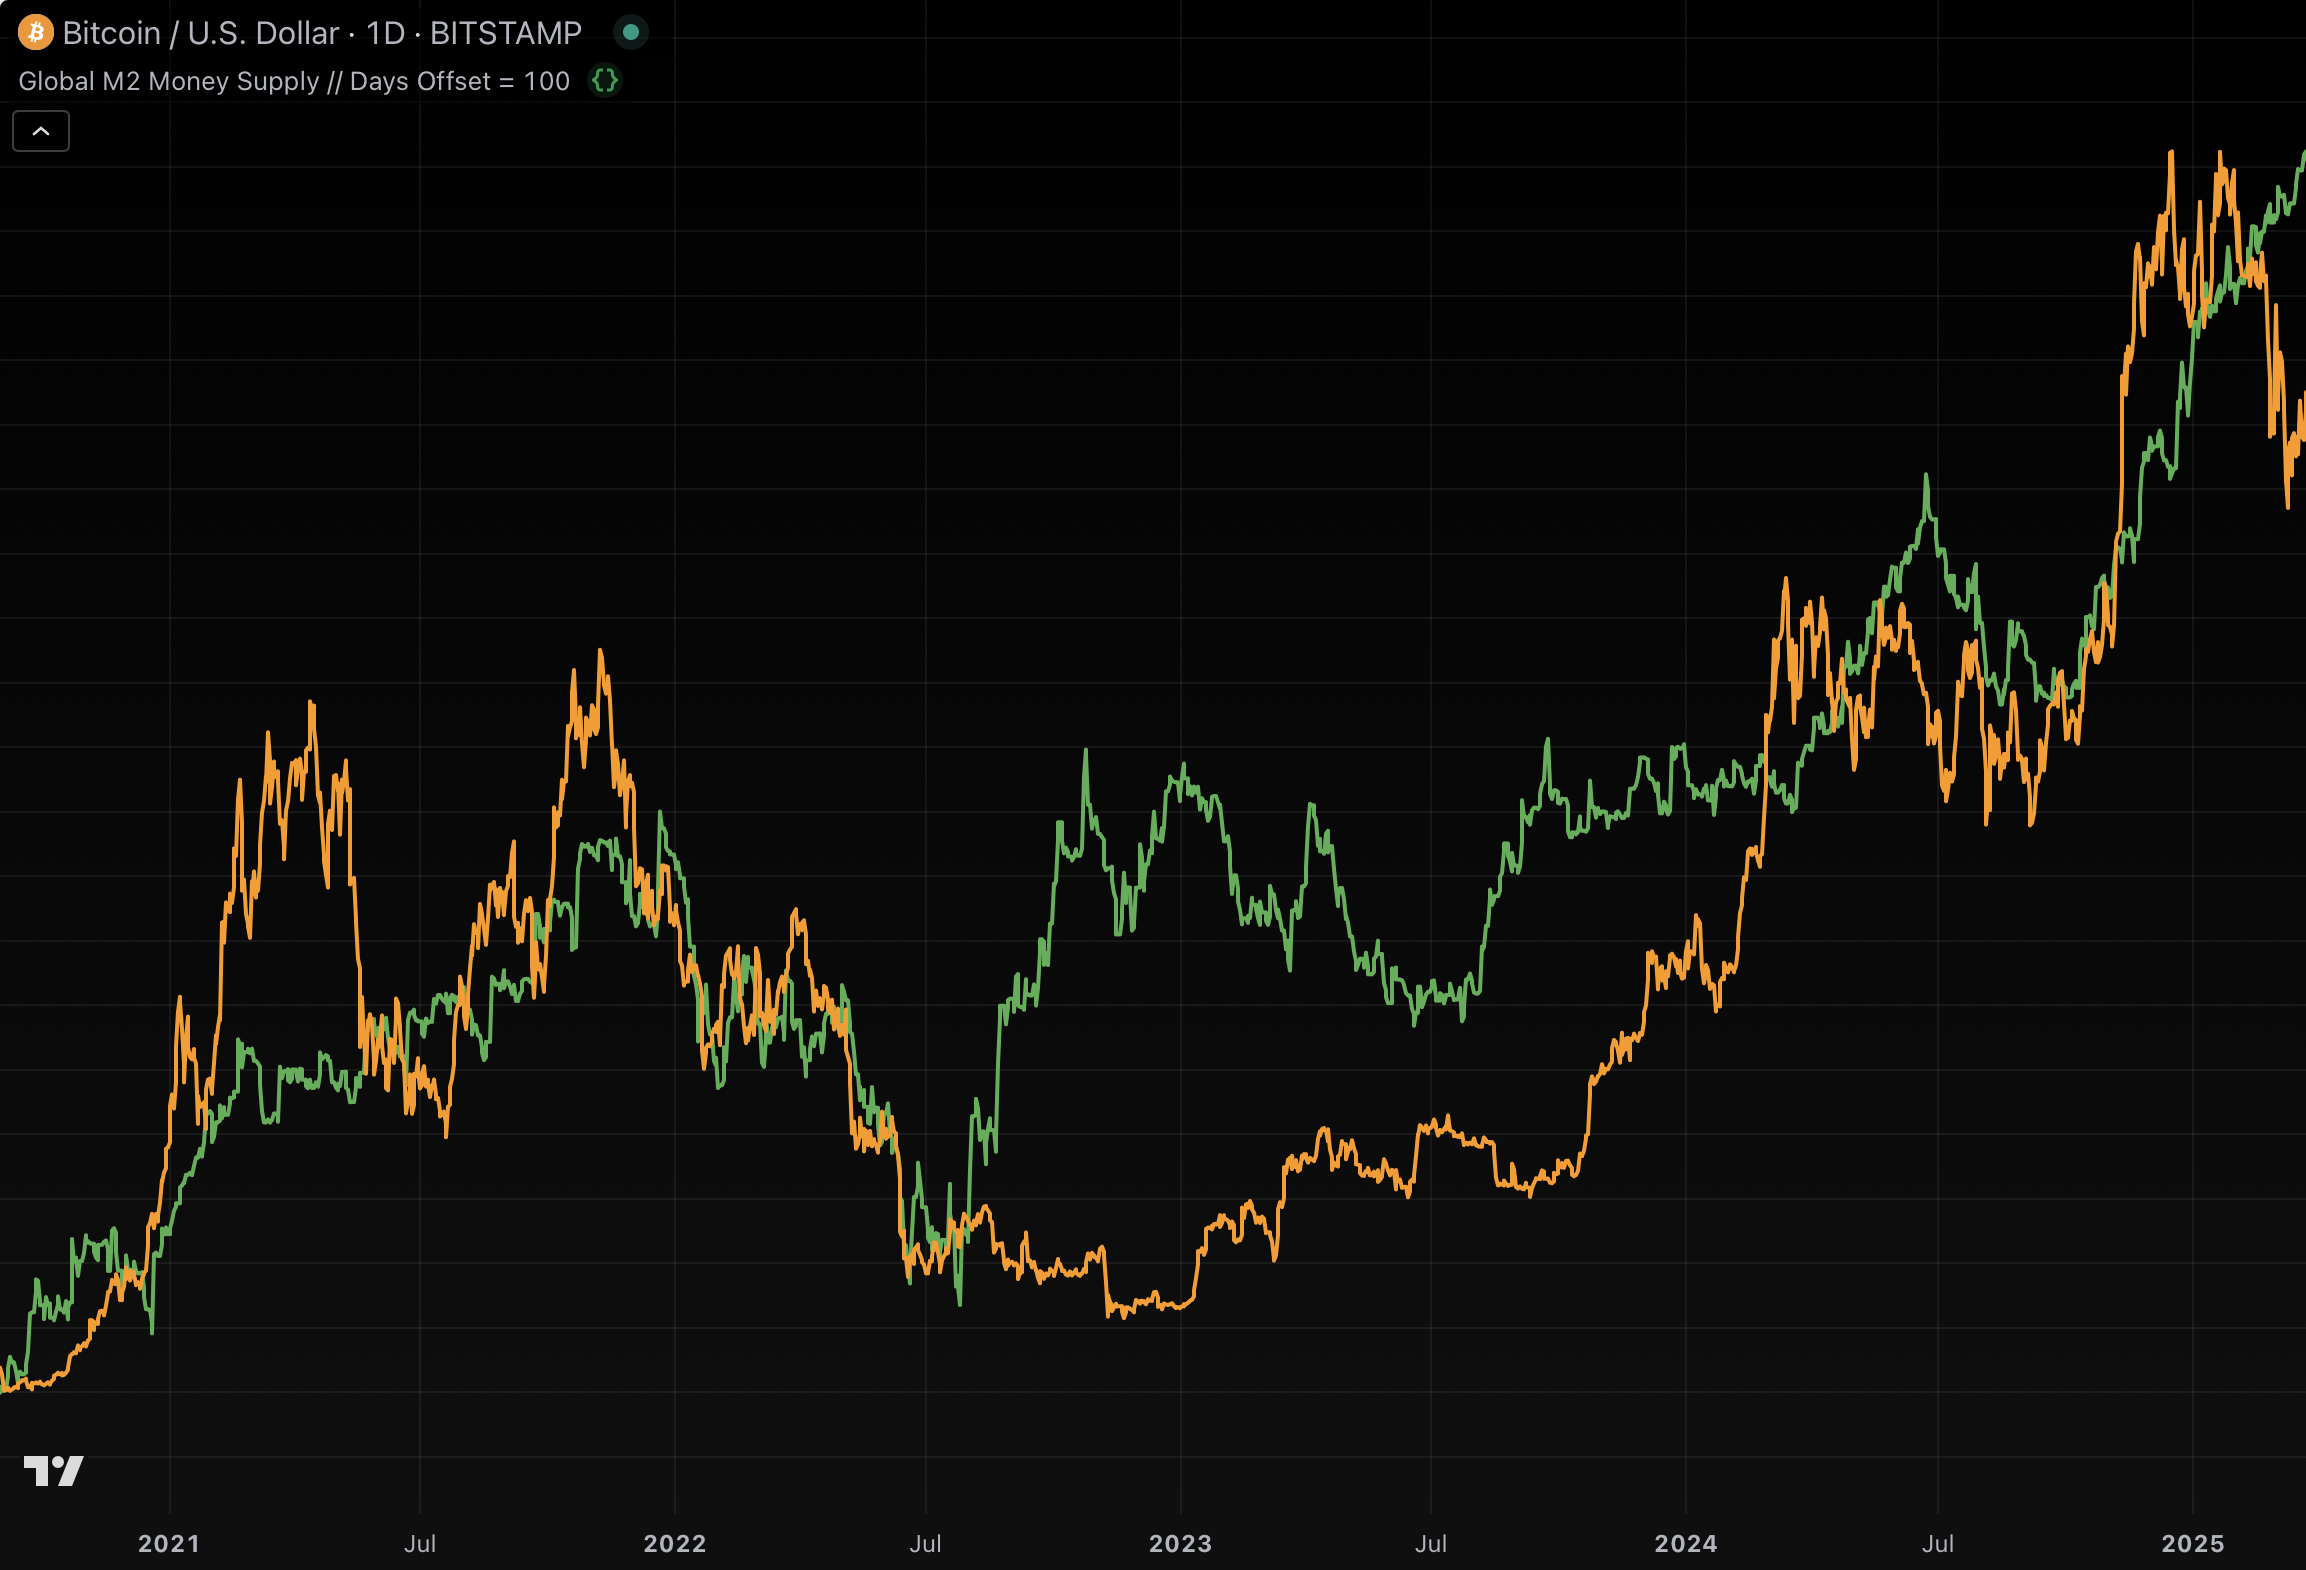
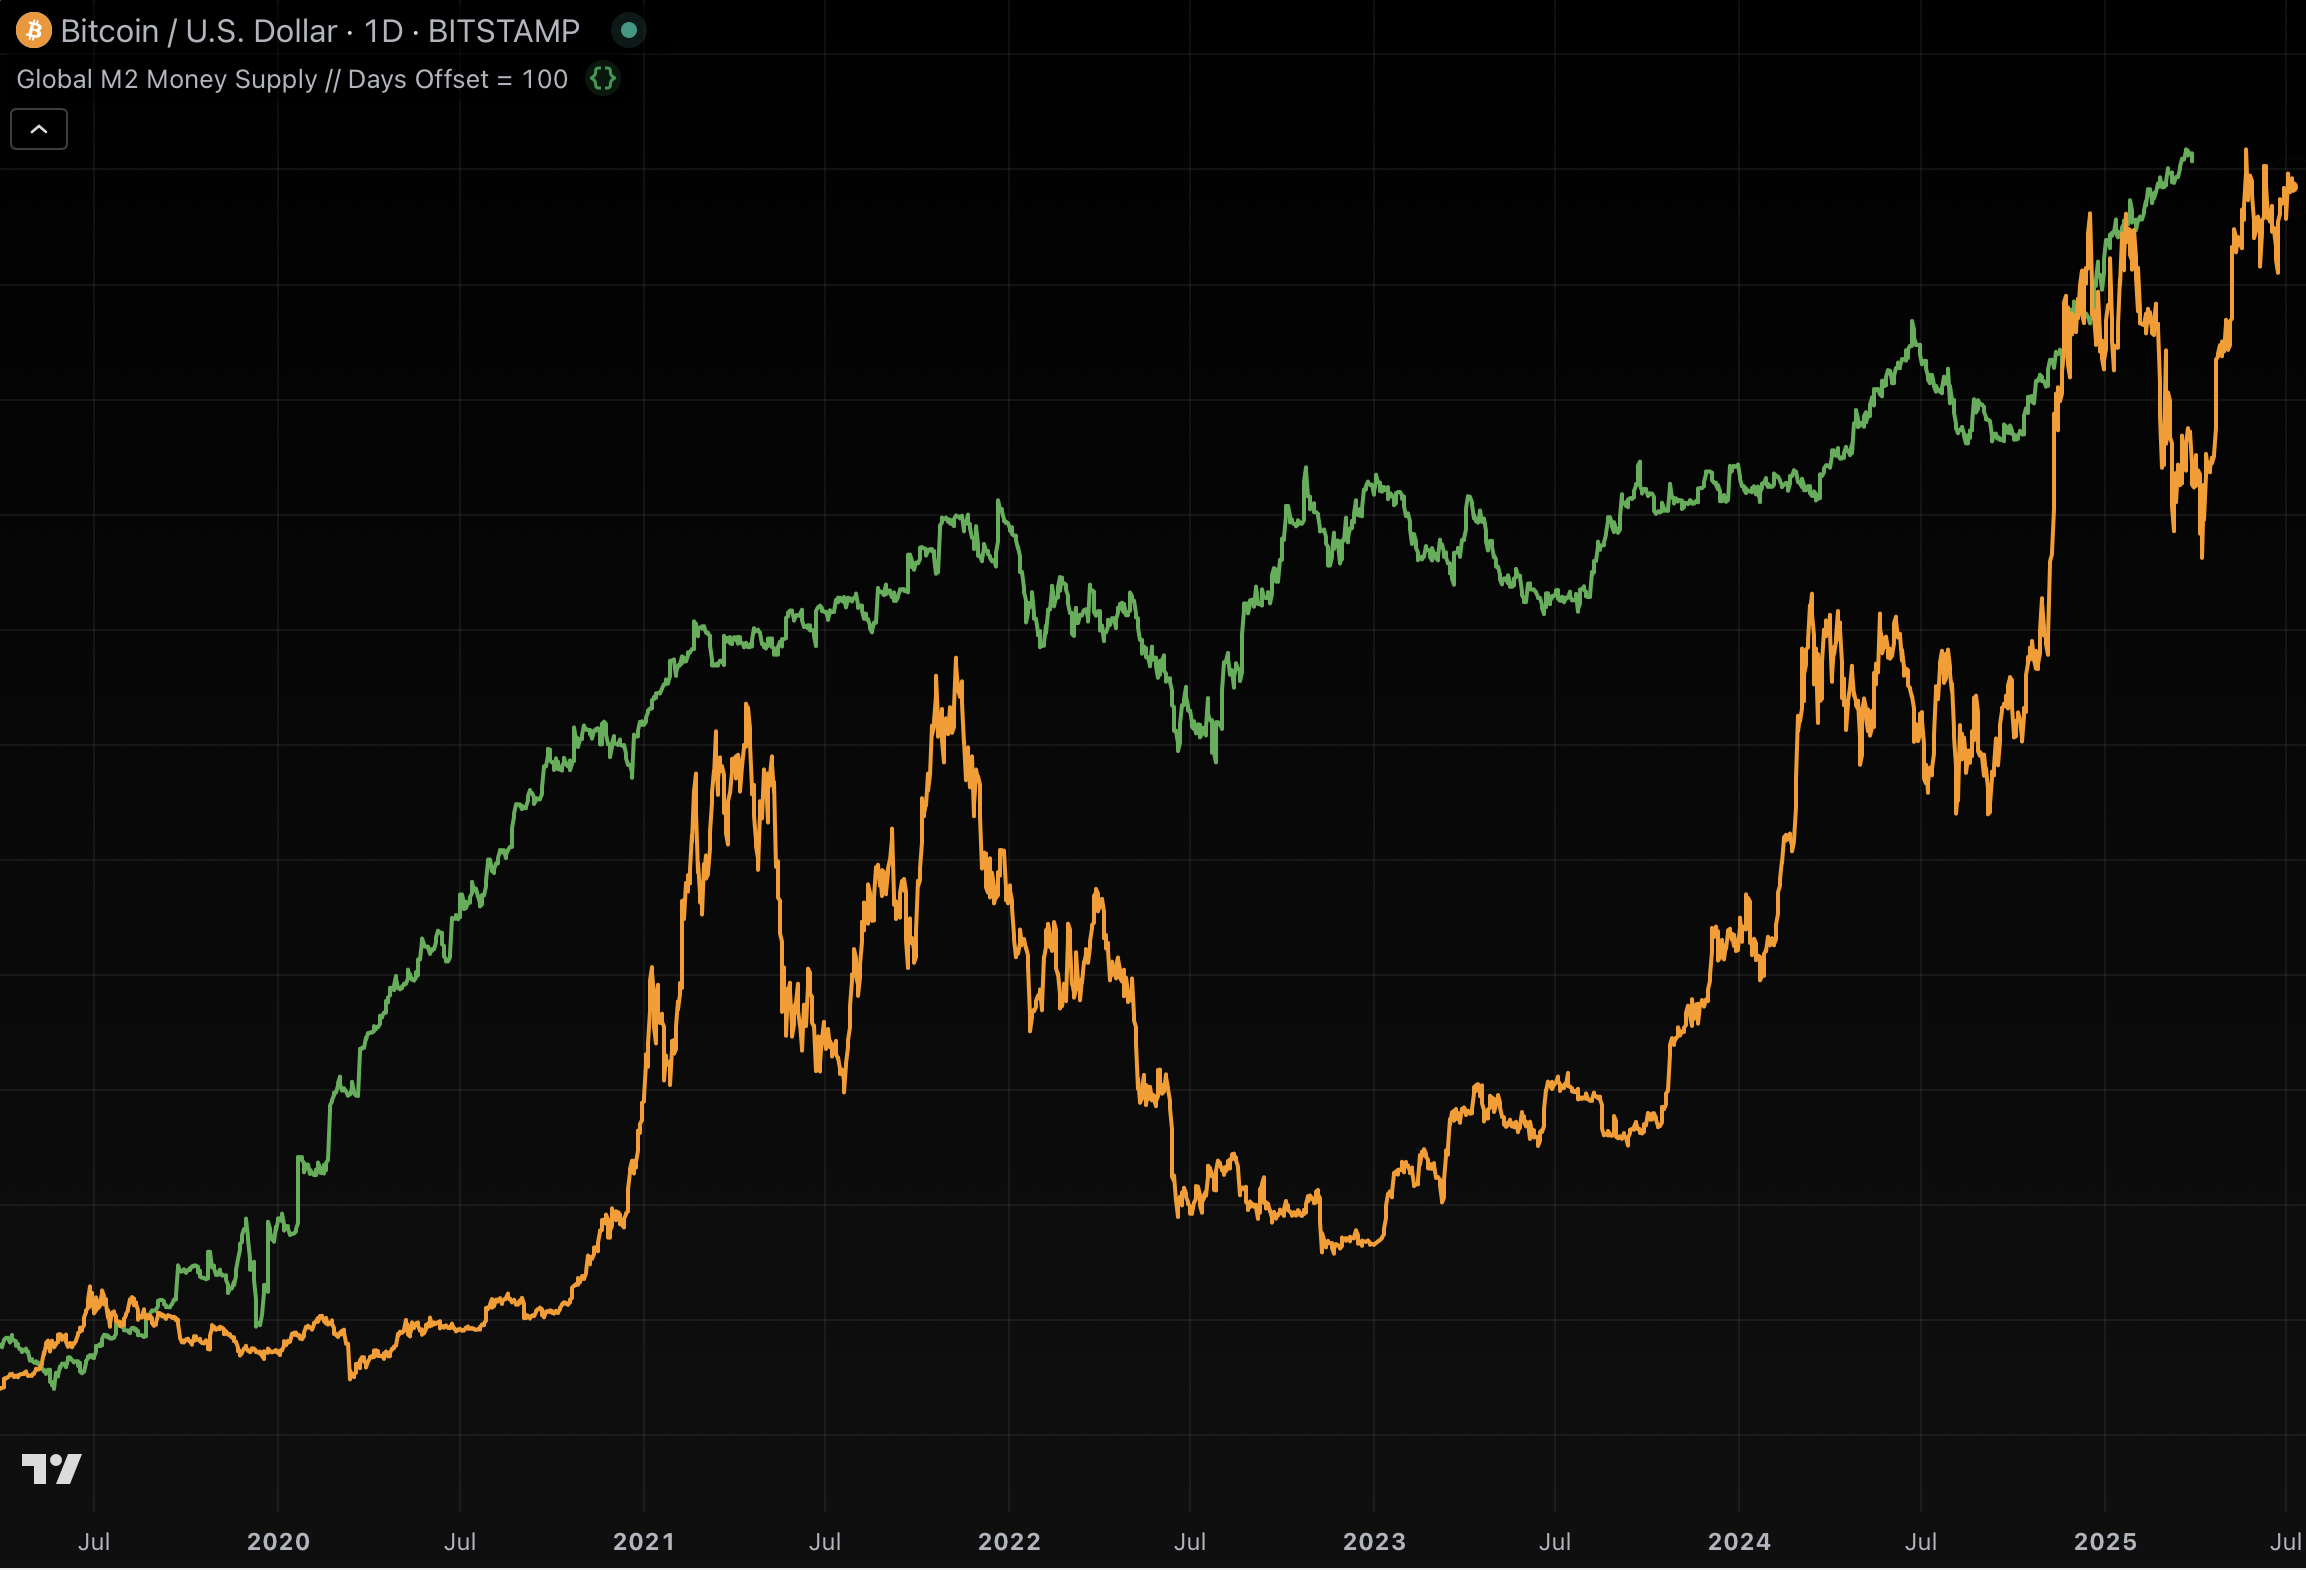
However, Protos has illustrated how these data inputs can be decoupled simply by editing the zoom setting from 2021 to present (left) to 2019 to present (right).
M2 is the total quantity of money in cash, checking and savings accounts, travelers checks, small time deposits, and money market funds across the world’s major economies.
M stands for “money” and the number 2 indicates the breadth of the definition. M2 is the second, more inclusive definition after M1 which excludes savings accounts and money market funds.
In the first chart on the left, the green M2 line appears to smoothly rise and fall with the orange BTC line. On the second chart to the right, M2 soars two years before BTC rallies to catch up, even reaching a new high in November 2022 while BTC crashes into the bankruptcy of FTX.
BTC versus M2: Correlation versus causation
Unfortunately, technical analysts often suffer from cognitive biases. Because they almost always analyze data visually, they are prone to curve-fitting.
Humans are naturally biased to see patterns, even amid arbitrary randomness, and fitting the curves of charts to rise and fall together in certain timeframes is a textbook fallacy.
Moreover, technical analysts often forget about data dredging.
Also known as data snooping or the backtesting fallacy, searching multiple inputs and highlighting only the most highly correlated data — even if that correlation could be as spurious as the thousands of other, disregarded data — is an obvious failure to distinguish correlation from causation.
Indeed, any backtesting software like Bloomberg or TradingView can instantly provide endless data inputs that amazingly correlate with unrelated inputs.
A classic example of two things correlating without any causative relationship is ice cream sales and drowning.
During summer months, both ice cream sales and drowning incidents increase. Charts of these data trend in perfect lockstep, yet they are completely unrelated and share no causative relationship.
Read more: Has the bitcoin treasury company bubble popped?
Statistical significance, not just overlapping lines
Moreover, M2 is a poor measure of fiat liquidity — which is far more correlated with the ability of investors to allocate fiat to purchase BTC.
Although the quantity of money increasing would seemingly correlate with the quantity of fiat available to purchase BTC, that purchasing power is actually better measured by liquidity, not M2.
In addition, skeptics note that although data might correlate over a given time period, what matters is statistically significant correlation.
Specifically, p-values measure the likelihood that a relationship between two variables is unlikely to arise by chance. Unfortunately, BTC p-values are far higher for measures of fiat liquidity than M2.
Lastly, technical analysts often forget about autocorrelation. M2 is simply the quantity of money, which obviously correlates with the denominator of all prices. In other words, M2 autocorrelates with the price of everything.
In short, M2 is simply one among countless data inputs that can mimic the chart of BTC. However, the correlation breaks down on various time frames, and it is unlikely that the relationship is causative rather than simply correlative.