Bitcoin ($BTC) traders expect a short-term correction as a key $BTC price strength metric rises to its highest levels in almost fifteen weeks.
Key takeaways:
- Bitcoin’s “overbought” RSI historically precedes significant corrections.
- Bitcoin could see a short-term price drop if the price breaks below the $78,000 support.
Bitcoin metrics suggest $BTC price is “overheated”
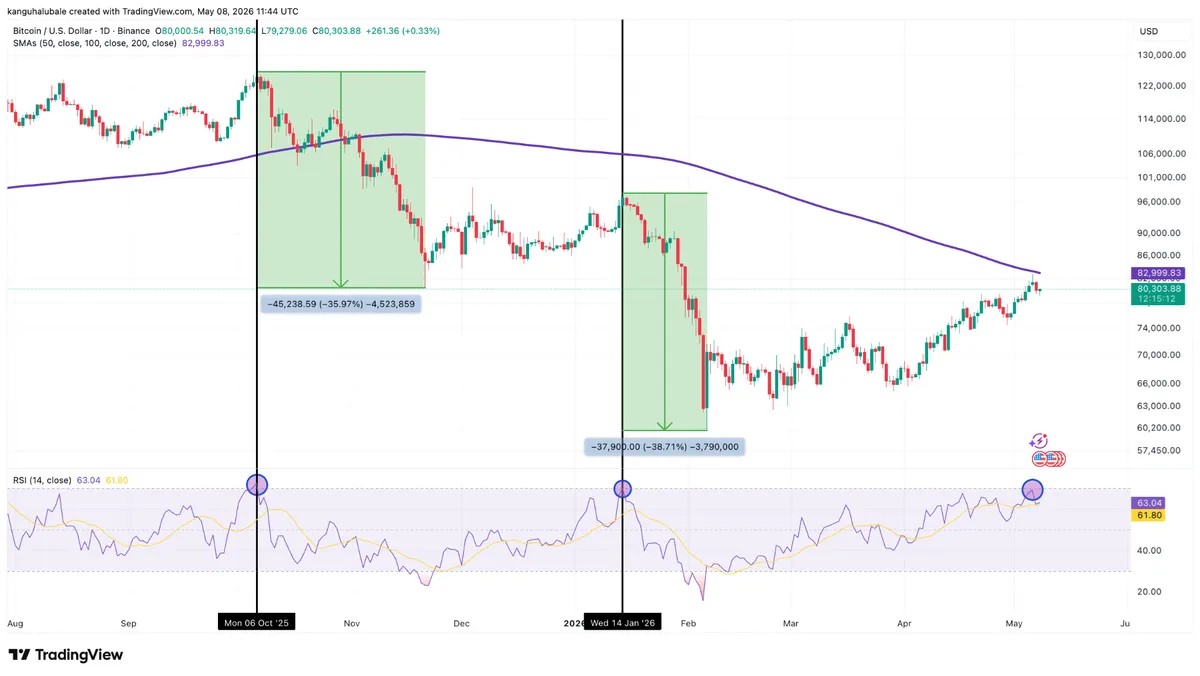
Bitcoin’s 36% rally to $82,800 on Wednesday from its macro low of $60,000 has significantly impacted its daily RSI.
On the daily chart, the RSI rose to 70 on Wednesday from local lows of 39 in March.
“$BTC’s daily RSI went overbought right as we tagged the 200-day EMA,” trader Jelle said in a Friday post on X, adding:
“It makes sense to find resistance here.”
$BTC/USD weekly chart. Source: Cointelegraph/TradingView
RSI measures trend strength and contains three key levels for observers: the 30 oversold boundary, the 50 midpoint and the 70 overbought threshold.
When the price crosses these levels, depending on the direction, traders can infer about the future of the current trend. After rallies, $BTC usually corrects once the RSI enters the overbought territory.
Related: Bitcoin bulls target $115K by December: Does data back the expectation?
Analyst Crypto Tice said this is a “rare” signal that has occurred only four times over the last year, with every occurrence leading to a “short-term pullback,” adding:
“Overbought conditions on the daily don’t resolve sideways. They resolve with a flush.”
Fellow analyst Rekt Fencer pointed out that the “last 2 times this happened, it dumped” 35%-38%, as shown in the chart above.
Meanwhile, Bitcoin’s market value to realized value (MVRV) ratio, which measures whether the asset is overvalued, recently entered the “overheated” zone.
“Bitcoin breaks above the overheated level on the short-term holder Bollinger Bands for the first time since November 2024,” analyst FrankAFetter said in a recent post on X.
The last time it was at similar levels was in November 2024 before a 15% $BTC price drop.
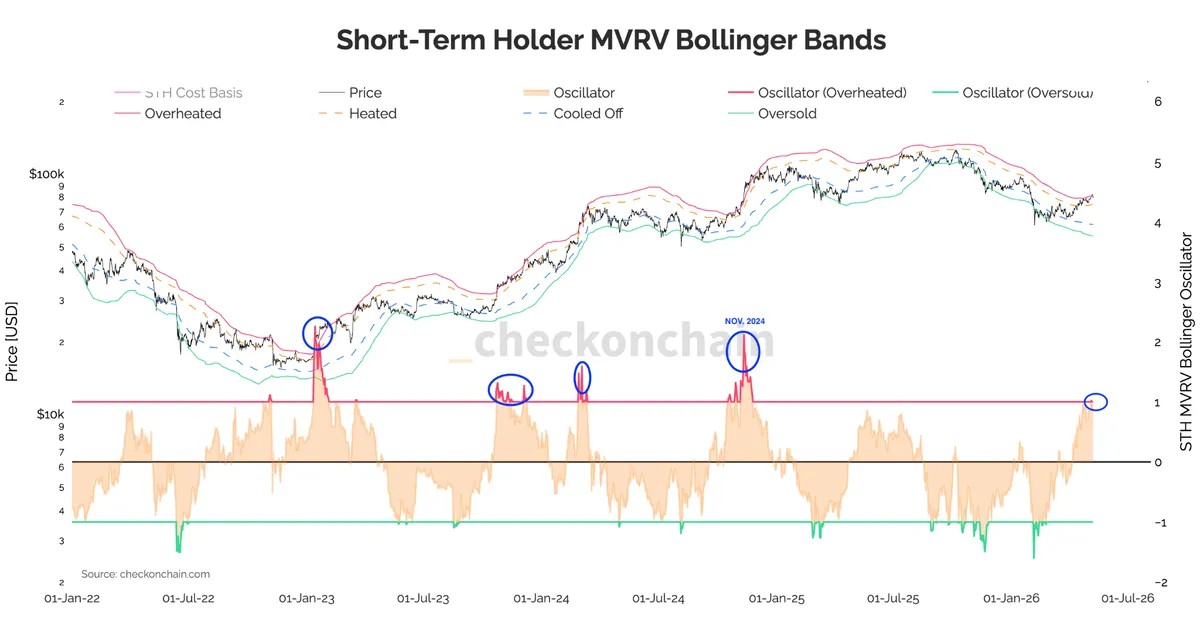
Bitcoin STH MVRV Bollinger Bands. Source: CheckOnChain
Bitcoin support at $78,000 becomes key for $BTC price
Bitcoin traders agree that $78,000 has now become an important area of support for $BTC/USD.
The 200-day exponential moving average at $83,000 is acting as resistance, while the “first main area of interest sits at $78,000,” analyst Jelle said in an X post on Friday, adding:
“Turn that into support and we can have another go at the MAs.”
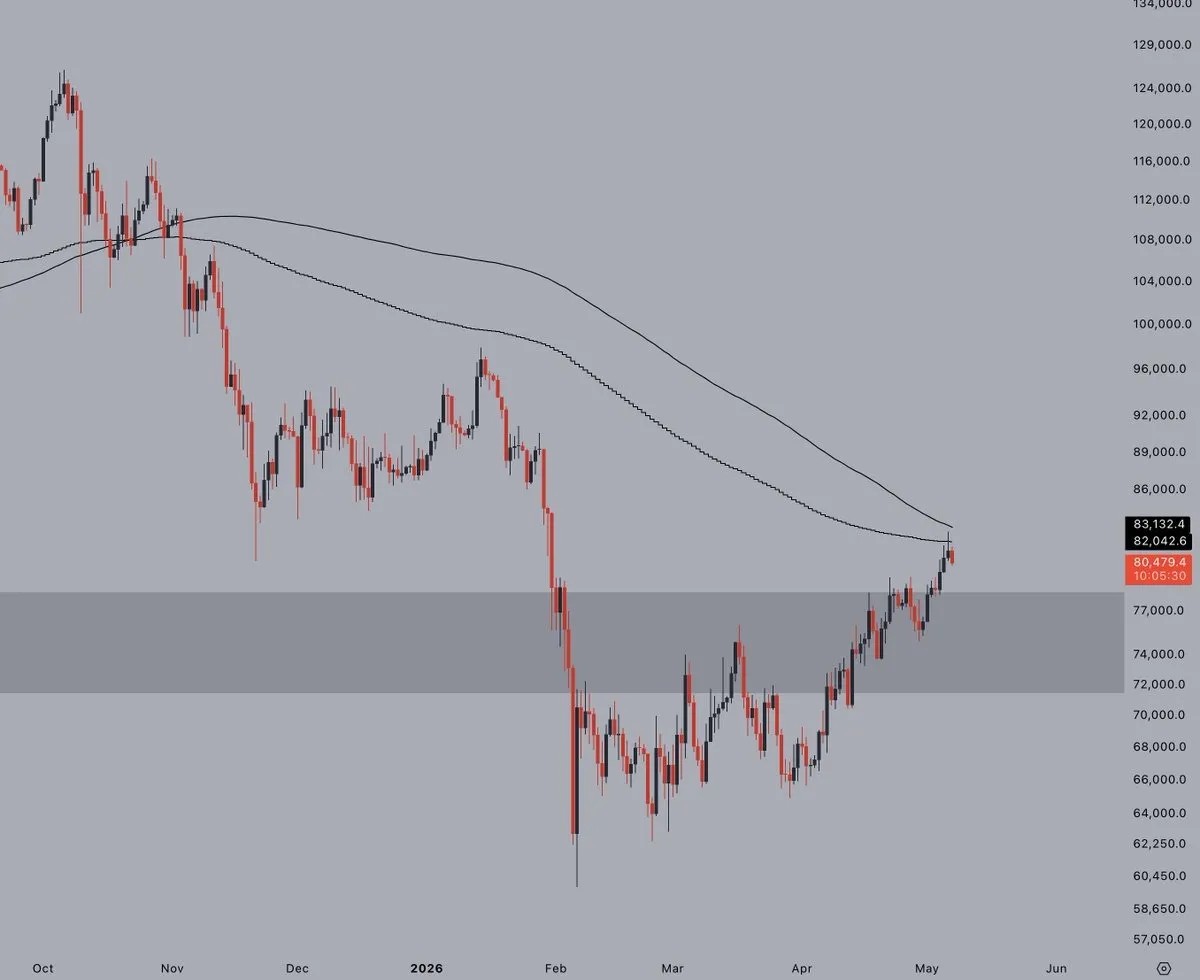
$BTC/USD daily chart. Source: X/Jelle
Fellow analyst Tradermayne said holding the support at $78,000-$80,000 on low time frames would give “bulls a very easy bias level.”
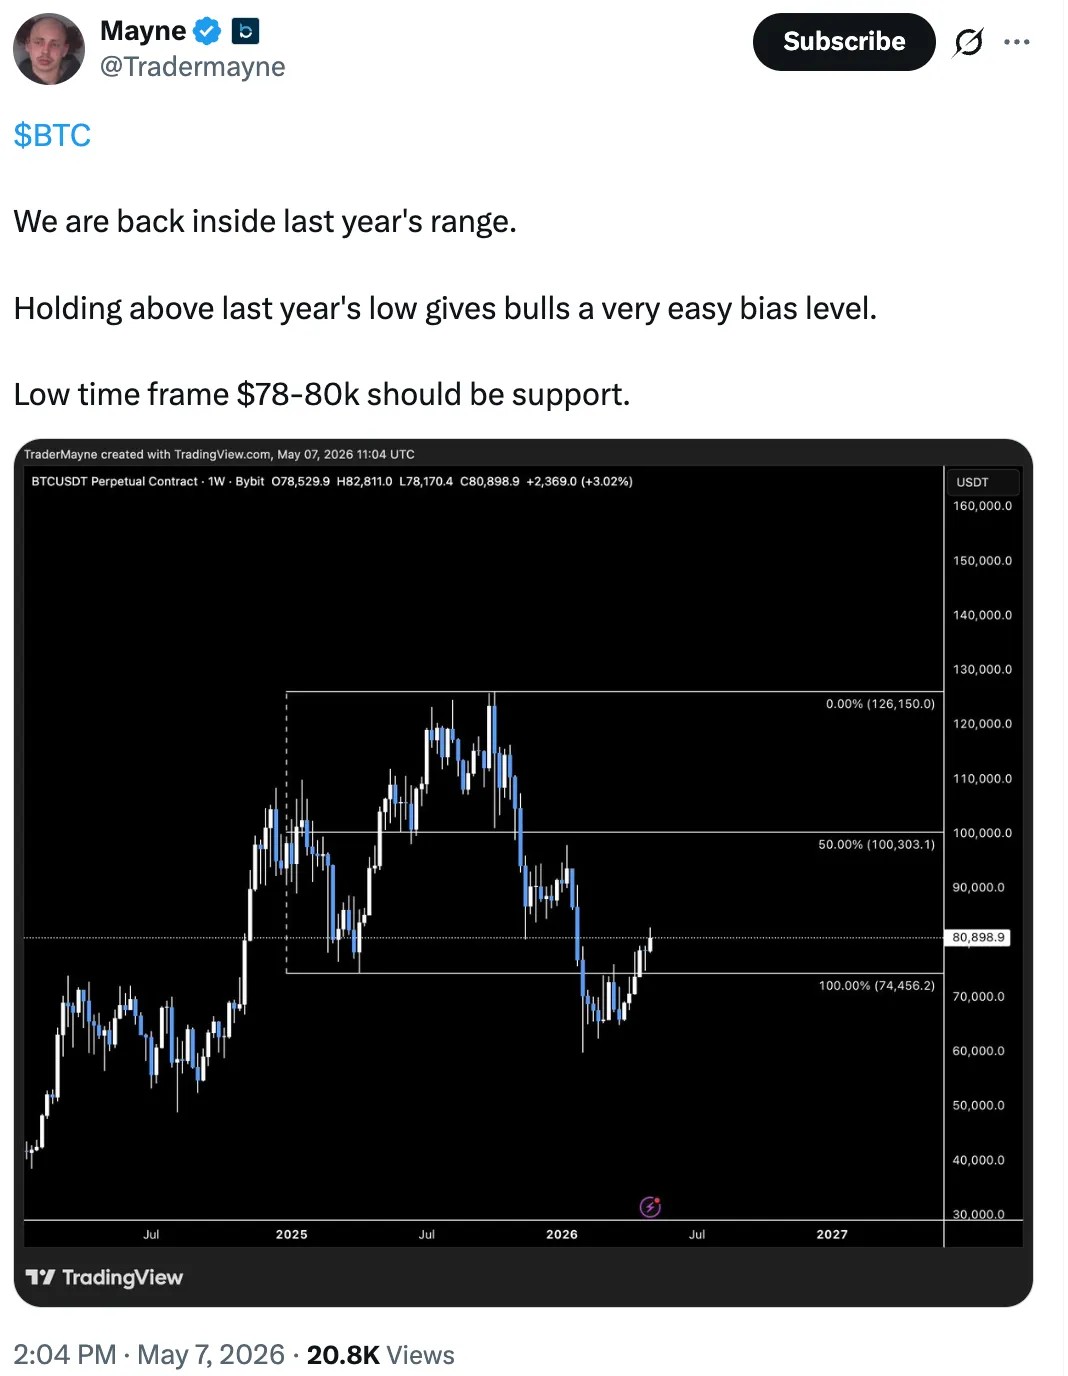
$BTC/USD weekly chart. Source: Trader Mayne
Orders are sitting on both sides of the spot price, with analyst Master of Crypto seeing the likelihood of these liquidity clusters being taken out.
“$BTC is holding around the $78.5K–$79.1K support zone,” the analyst said in a Friday post on X, adding:
“If buyers defend this area, the next move could be toward $82K–$83K where a lot of liquidity is sitting. But if this support breaks, Bitcoin could quickly drop to $75K–$76K.”
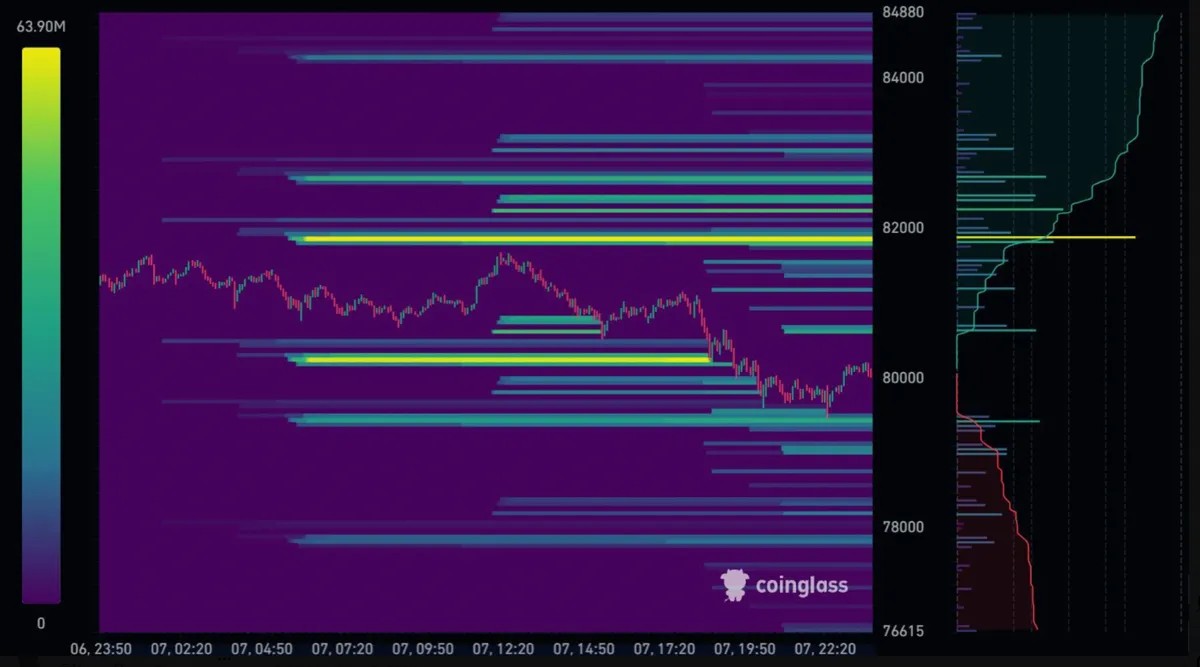
Bitcoin liquidation heatmap. Source: CoinGlass
The Bitcoin liquidity map shows that a correction below $78,000 would trigger over $3.1 billion worth of leveraged long liquidations across all exchanges.
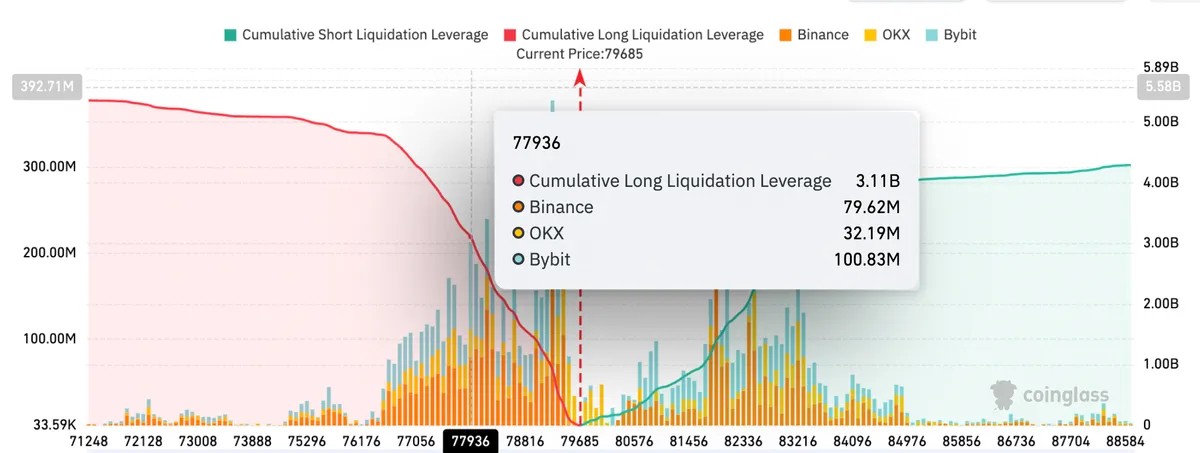
Bitcoin exchange liquidation map. Source: CoinGlass
This article is produced in accordance with Cointelegraph’s Editorial Policy and is intended for informational purposes only. It does not constitute investment advice or recommendations. All investments and trades carry risk; readers are encouraged to conduct independent research.