Bitcoin ($BTC) is approaching two major resistance zones that could determine its next market direction, according to cryptocurrency analyst Michael van de Poppe.
In an X post on May 9, the analyst identified the first key resistance area between $86,000 and $88,000, while the second and more significant zone sits between $93,000 and $95,000, aligning with Bitcoin’s 50-week moving average (MA).
Poppe noted that in previous market cycles, including 2017, 2021, and 2024, Bitcoin’s initial recovery rallies often faced rejection near former support levels or the 50-week moving average before establishing a sustained uptrend. He suggested the current setup is following a similar pattern.
His analysis showed Bitcoin recently breaking below the 50-week moving average, while the 200-week moving average is acting as key long-term support near the low $70,000 region.
The insights also identified the $93,000 to $95,000 zone as a likely resistance area where sellers could regain control if the rally weakens.
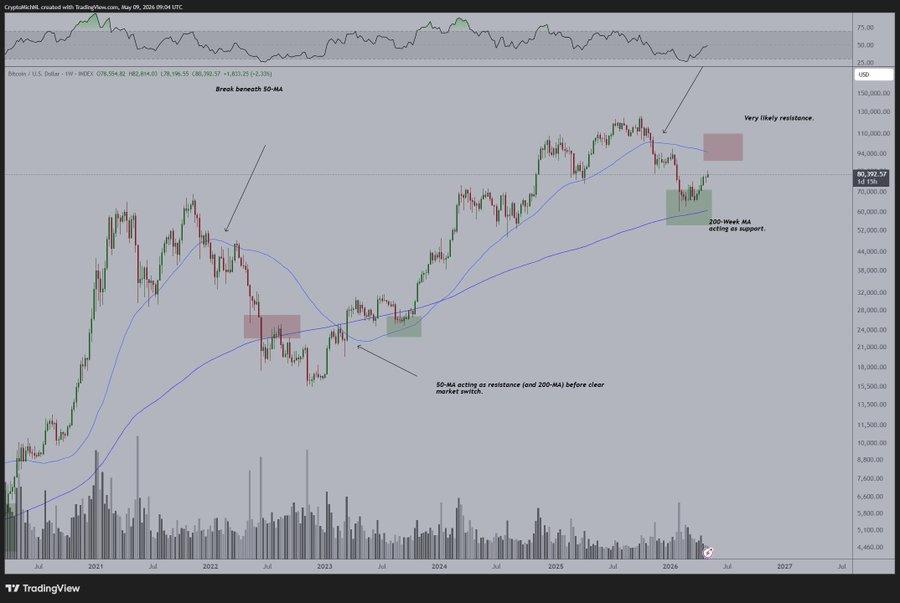
The outlook suggested Bitcoin may consolidate for several weeks beneath resistance, similar to previous cycles when extended ranging periods preceded broader upward trends and allowed altcoins to outperform.
To this end, the expert added that Bitcoin could still retest the $70,000 to $75,000 range before continuing higher, although he believes the broader bear market bottom is already in place.
Bitcoin exchange reserves fall
Additional on-chain data shared by analyst Ali Martinez on May 8 reinforced the longer-term bullish outlook.
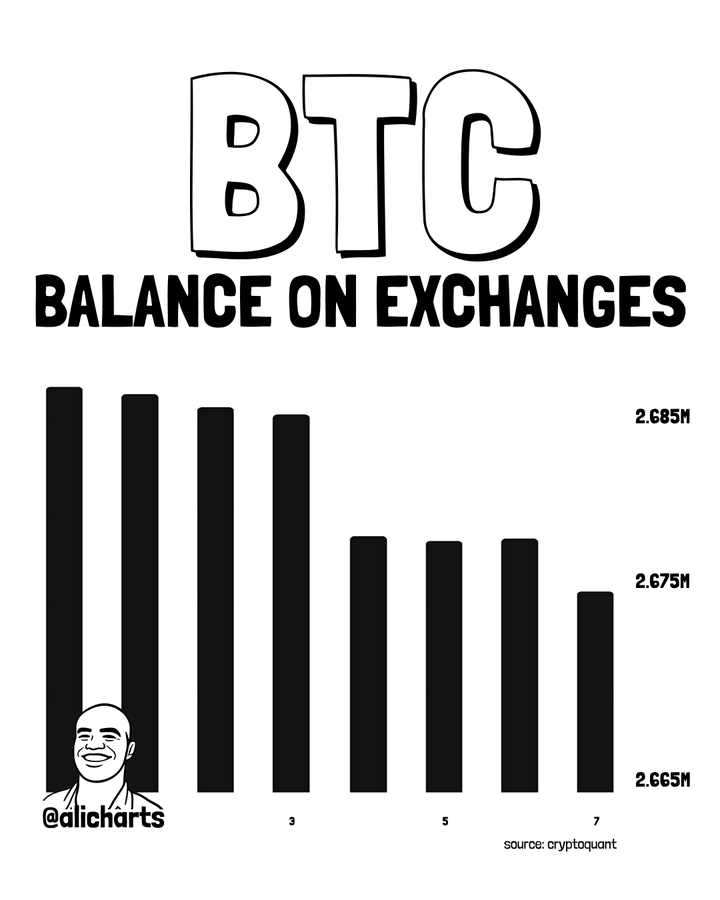
Martinez reported that about 7,400 Bitcoin had been withdrawn from exchanges over the previous week, a development typically associated with reduced immediate selling pressure as investors move holdings into private wallets for longer-term storage.
Data shows Bitcoin reserves on trading platforms are steadily declining toward the 2.675 million $BTC level.
Historically, falling exchange balances have often coincided with stronger price support, as fewer coins available on exchanges can reduce near-term sell-side liquidity and strengthen bullish momentum if demand remains elevated.
Bitcoin price analysis
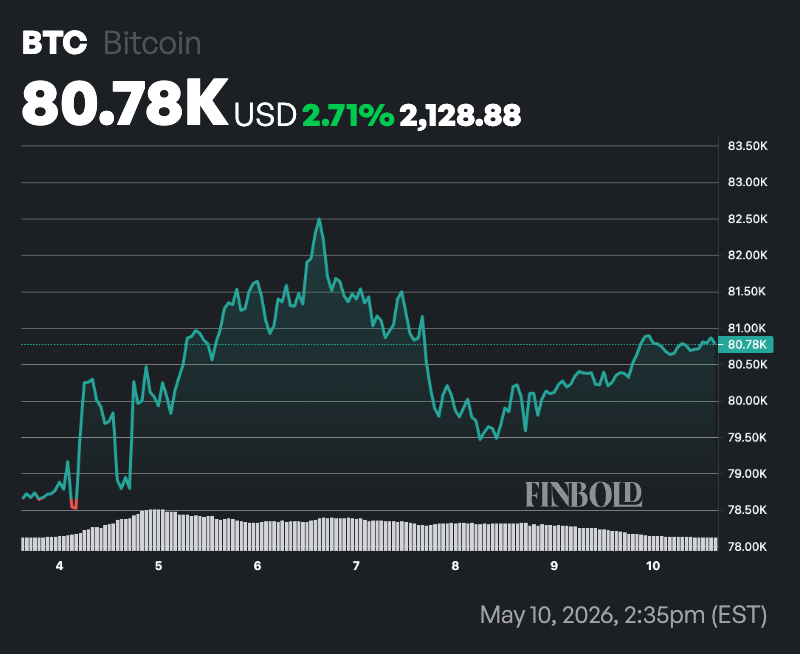
The bullish outlook comes as recent price action has shown modest gains this week, but remains choppy.
Bitcoin briefly dipped below $80,000 before recovering. Over the past three months, $BTC has climbed from around $63,000 into the $80,000 range, marking a solid recovery, though it still trades well below its all-time high above $125,000 reached earlier in this cycle.
At press time, Bitcoin was trading at $80,780, up about 0.5% in the past 24 hours. On the weekly timeframe, the asset has gained nearly 3%.
Volatility has remained relatively contained in recent sessions, with analysts watching for a potential breakout toward $85,000 if bullish catalysts such as continued ETF inflows and supportive technical indicators persist.