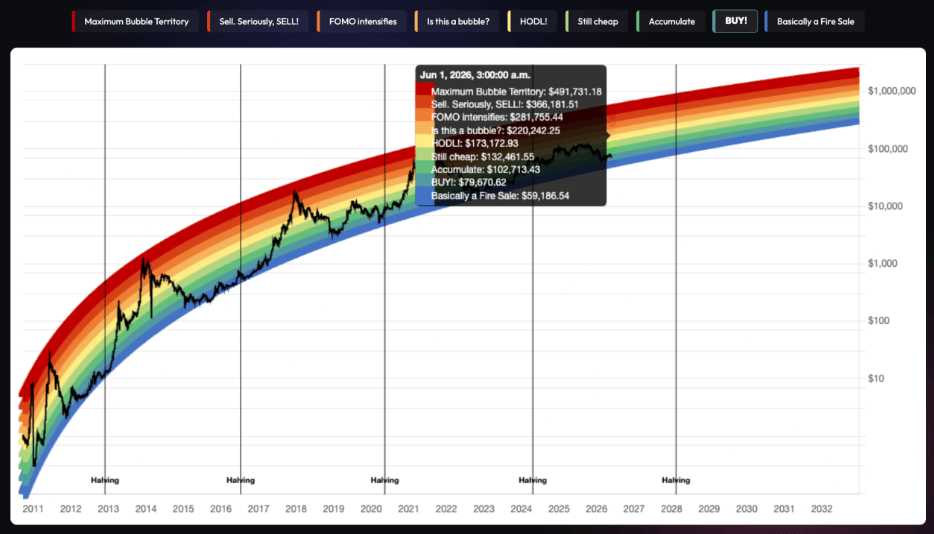
The Bitcoin ($BTC) Rainbow Chart is signaling that the cryptocurrency could trade within a broad range of approximately $59,000 to nearly $492,000 by June 1, 2026, depending on market sentiment and the stage of the current market cycle.
With Bitcoin trading around $77,000, the cryptocurrency currently sits within the chart’s ‘BUY!’ zone, suggesting the model still considers $BTC relatively undervalued compared to its long-term historical trajectory.
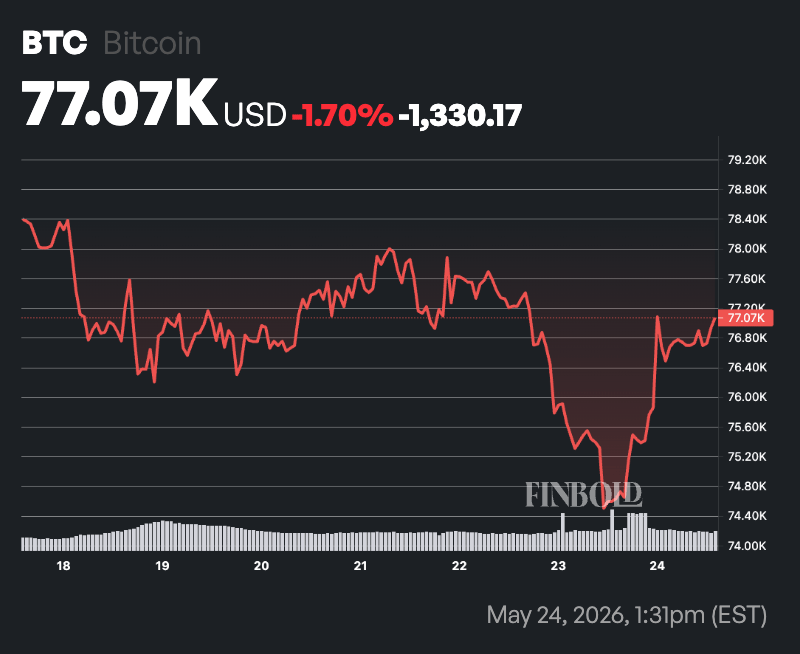
Overall, based on the Rainbow Chart bands, Bitcoin’s most immediate upside target for June 1, 2026, would be around $79,670 if it remains within the same valuation range.
However, if bullish momentum accelerates throughout the cycle, the model suggests $BTC could climb into progressively higher bands beyond $100,000 and potentially toward the upper six-figure range.
According to the chart data, the lowest projected band for June 1, 2026, is the ‘Basically a Fire Sale’ zone at approximately $59,186. Historically, this range has represented deep bear market conditions where Bitcoin traded significantly below its long-term growth curve.
The next level is the ‘BUY!’ band at roughly $79,670, which is considered a favorable long-term entry zone where investors have historically accumulated Bitcoin ahead of stronger recoveries.
Above that sits the ‘Accumulate’ band at approximately $102,713. This range reflects conditions where Bitcoin is still viewed as undervalued despite growing bullish sentiment.
The ‘Still Cheap’ zone places Bitcoin around $132,461 and has historically indicated moderate optimism while still suggesting room for further upside.
On the other hand, the chart’s ‘HODL!’ band projects Bitcoin near $173,173. This area is typically associated with sustained bullish momentum and strong investor confidence during mature stages of a bull market.
Bitcoin speculative outlook
Further up the scale is the ‘Is this a bubble?’ zone at approximately $220,242. Historically, this band has aligned with increasingly speculative market activity and stretched valuations.
The ‘FOMO intensifies’ band estimates Bitcoin at around $281,755, representing periods where retail participation and fear-of-missing-out buying accelerate sharply.
Near the top of the model is the ‘Sell. Seriously, SELL!’ band at roughly $366,181, which historically signals overheated conditions where prices move far above long-term trend levels.
The highest projection on the Rainbow Chart is the ‘Maximum Bubble Territory’ band at approximately $491,731. This red-zone area has historically coincided with peak market euphoria and unsustainable speculative excess before major corrections emerged.
Notably, the Bitcoin Rainbow Chart is a long-term model that uses color-coded bands to track Bitcoin’s historical market cycles and investor sentiment.
However, the model is not designed to provide exact price predictions, especially as institutional adoption, ETFs, and macroeconomic trends continue to reshape the crypto market.