Bitcoin is testing a key weekly support area as two charts point to the same major level near the current trend zone. Surf’s chart shows $BTC pressing against downtrend resistance near the 200 weighted MA, while Daan Crypto Trades highlights the bull market support band around $75,000 to $78,500.
Bitcoin Weekly Chart Shows $BTC Testing Downtrend Near 200 Weighted MA
Bitcoin’s weekly chart shows $BTC sitting near an important technical area, where the descending trendline meets the 200 weighted moving average.
The chart shared by Surf compares the current setup with earlier Bitcoin cycle phases. In 2018 and 2022, $BTC broke below a descending trendline, moved near the 200 weighted MA, and later recovered after the downtrend weakened.
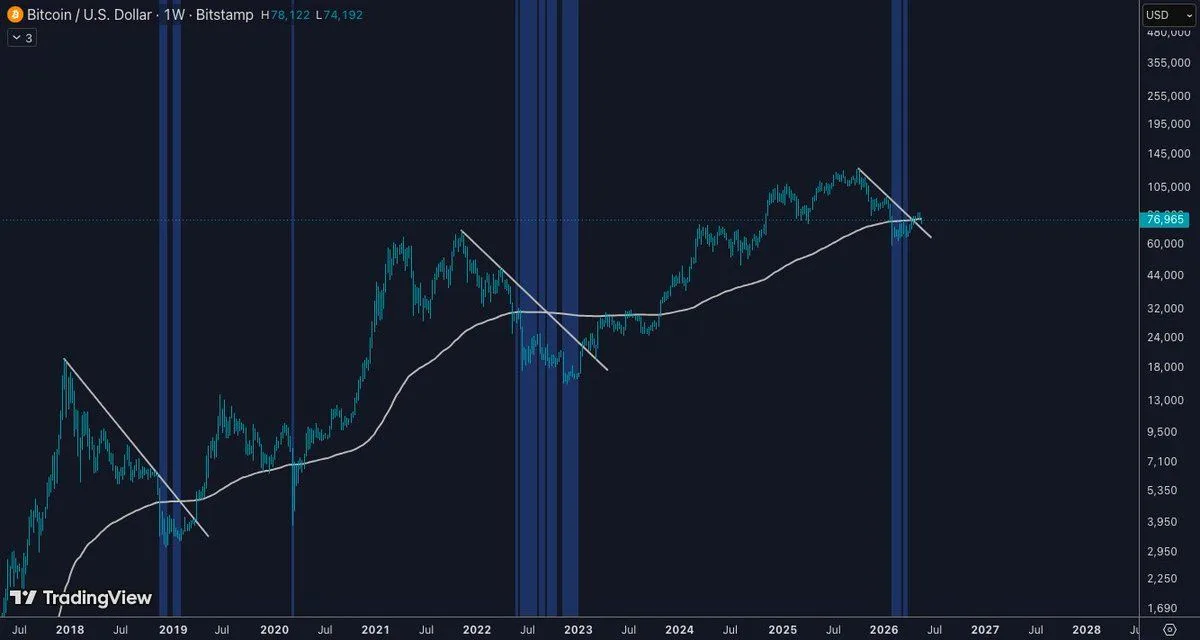
Bitcoin Weekly Surf Indicator Chart. Source: Surf on X
The same pattern now appears on the right side of the chart. $BTC has pulled back from its recent high and is testing a short descending trendline. The 200 weighted MA sits close to the same area, making this zone important for the next weekly move.
The blue vertical bands from the Surf Indicator also mark past areas where Bitcoin entered major transition zones. Earlier bands appeared near cycle bottoms or recovery phases. The latest band now appears around the current price structure.
A clean break above the descending trendline would show that selling pressure is slowing. It would also place $BTC back above a key weekly trend area.
However, if Bitcoin fails to hold near the 200 weighted MA, the chart could point to more sideways movement or another support test.
For now, the setup is simple. Bitcoin is testing a familiar weekly structure: downtrend resistance, the 200 weighted MA, and a Surf Indicator zone that has marked major cycle areas before.
Bitcoin Price Chart Shows $BTC Retesting Bull Market Support Band
Bitcoin is retesting the bull market support band on the weekly chart shared by Daan Crypto Trades.
The chart shows $BTC moving around the same area as the band, which sits near the $75,000 to $78,500 range. This zone is important because bulls need to hold it to keep short and mid term momentum in their favor.
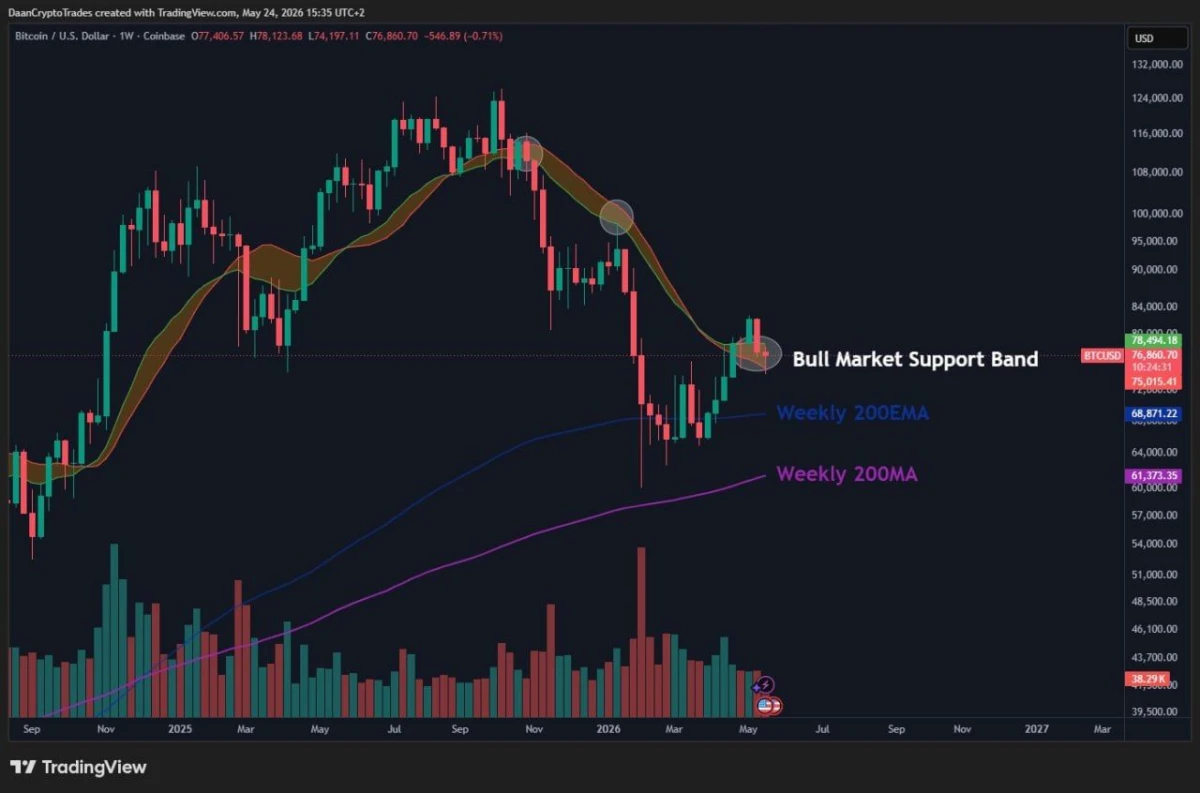
Bitcoin Bull Market Support Band Chart. Source: Daan Crypto Trades on X
The support band acted as a trend area during previous moves. Now, Bitcoin is testing it again after recovering from its latest pullback.
The chart also shows the weekly 200 EMA near $68,871. That level sits below the current support band and could become the next major area if $BTC loses the retest zone.
The weekly 200 MA sits lower, near $61,373. This makes it a deeper support level, not the first level in focus.
Daan Crypto Trades said $BTC is “holding on” to the bull market support band retest. That means the setup has not broken down yet, but buyers still need to defend this range.
For now, the main level is clear. Bitcoin needs to hold the $75,000 to $78,500 support band to keep momentum on the bulls’ side.