Bitcoin is trying to turn a short term bounce into recovery after a five wave decline shifted pressure to the downside. A break above $74,250 could open the path toward $76,150, but the bigger resistance zone remains $77,486 to $80,501.
Bitcoin Price Completes Five Wave Decline as $BTC Faces $77K to $80K Resistance
Bitcoin has completed a five wave decline on the four hour chart, giving the first sign that the short term trend may have shifted lower, according to a chart shared by Man of Bitcoin on X.
The analyst said $BTC’s key resistance for a possible wave two retracement sits between $77,486 and $80,501. However, he added that there is still no confirmation that the retracement has started.
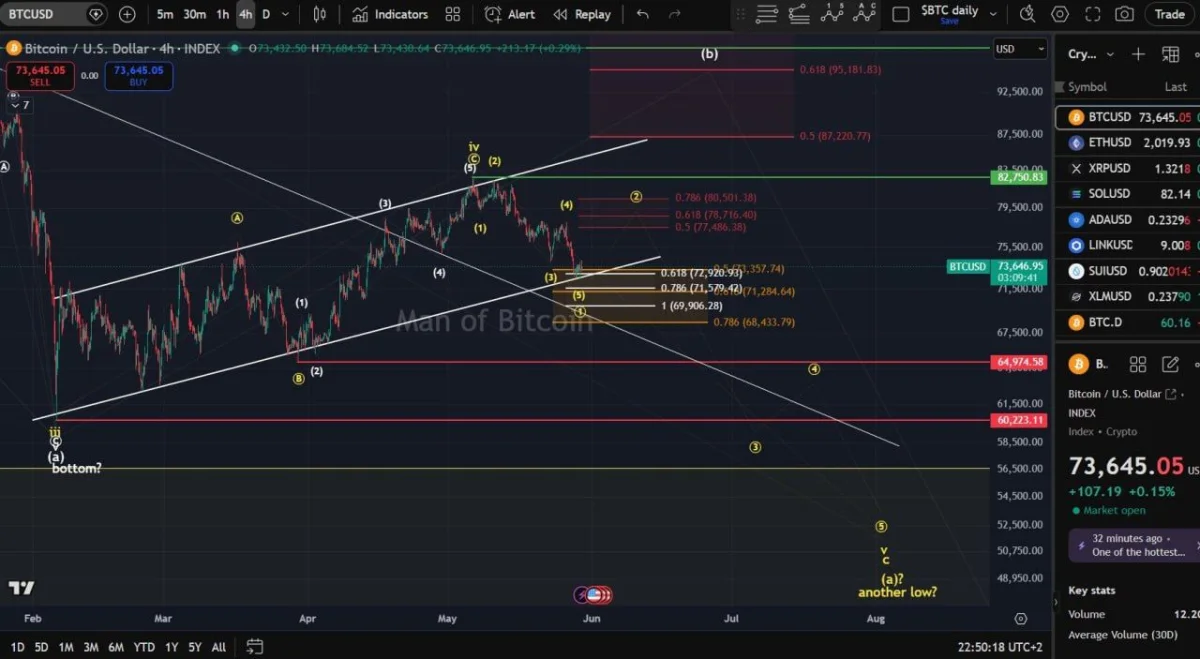
Bitcoin Four Hour Chart. Source: Man of Bitcoin on X
The chart shows Bitcoin falling from its recent high near the $82,750 area after breaking below a rising structure. The move formed a five wave decline, which the analyst marked as the first signal of a possible downside trend shift.
After the drop, $BTC moved toward a support cluster around the low $70,000s. The chart marks several nearby Fibonacci levels, including $72,920, $71,579, $71,284, and $69,906.
The main upside area now sits between $77,486 and $80,501. That zone represents the possible wave two retracement area if Bitcoin begins a relief bounce from the current range.
A move into that resistance band would not automatically confirm a bullish reversal. Under this setup, it would mainly show a corrective bounce after the first five wave decline.
The chart also shows deeper downside levels if sellers keep control. The next major red levels sit near $64,974 and $60,223, while a lower projected path points toward another possible low later in the structure.
For now, the analyst said wave two has not been confirmed. That keeps Bitcoin in a waiting phase, with traders watching whether $BTC can bounce toward $77,486–$80,501 or continue lower from the current support area.
Bitcoin Price Eyes Recovery as $BTC Tests $74,250 Breakout Level
Bitcoin is pushing toward a short term resistance zone near $74,250, according to a one hour chart shared by ChiefraT on X.
The analyst said $BTC could start a recovery if price breaks above $74,250. The next upside area sits between $76,050 and $76,150.
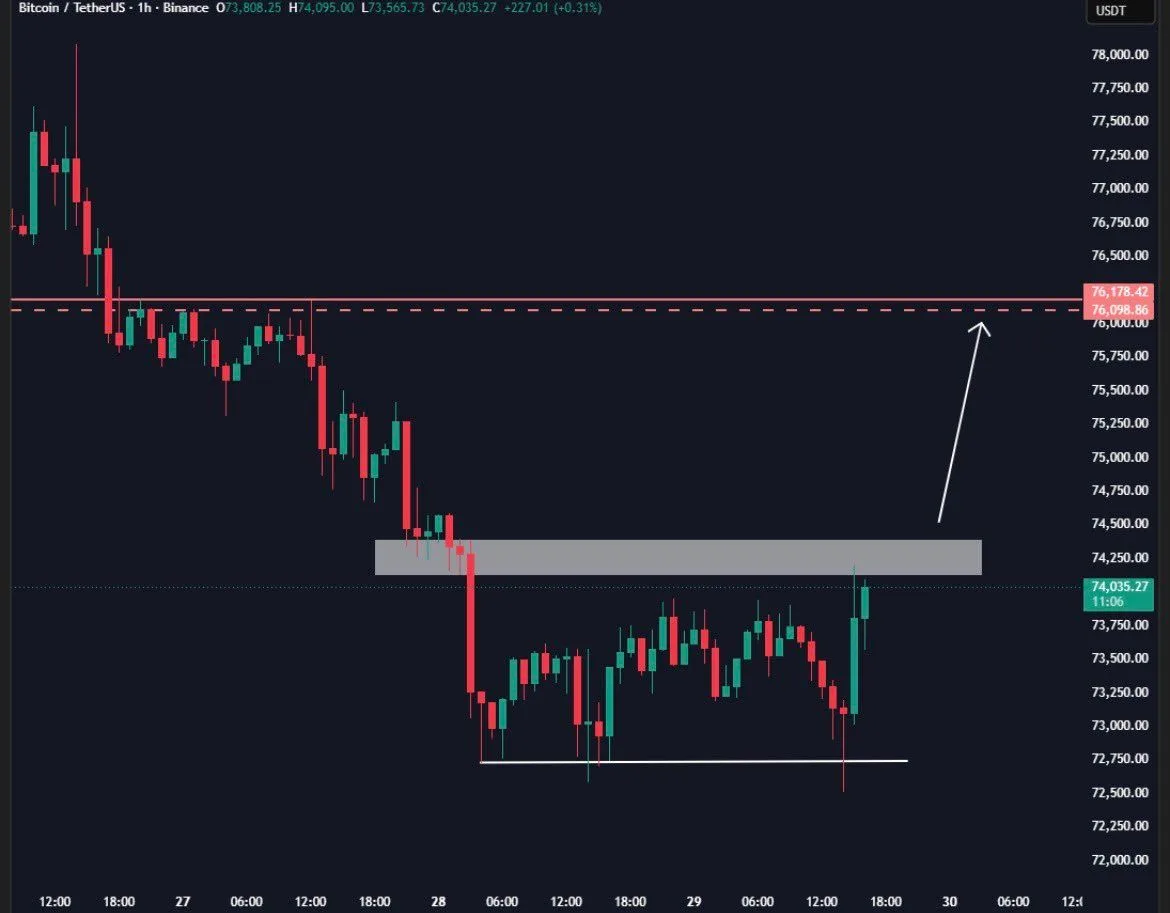
Bitcoin One Hour Chart. Source: ChiefraT on X
The chart shows Bitcoin recovering after forming a short term base near the $72,750 area. $BTC tested that support several times before bouncing toward the gray resistance zone.
That gray zone near $74,250 now acts as the first key barrier. A clean move above it would show that buyers are gaining control after the recent drop.
If Bitcoin clears that level, the chart points to a possible move toward the dashed resistance area near $76,098 to $76,178. That range matches the analyst’s recovery target.
However, $BTC still needs confirmation. A rejection from the $74,250 area would keep price stuck below resistance and could send it back toward the recent support near $72,750.
For now, the setup depends on whether Bitcoin can break above the gray zone and hold it as support. Without that move, the recovery target near $76,150 remains unconfirmed.