
Bitcoin is trading at $116,779 apiece on Aug. 8, 2025, with a market capitalization of $2.32 trillion and a 24-hour trading volume of $38.10 billion. The cryptocurrency moved within a narrow intraday range of $116,112 to $117,596, reflecting a consolidation phase after recent price swings.
Bitcoin
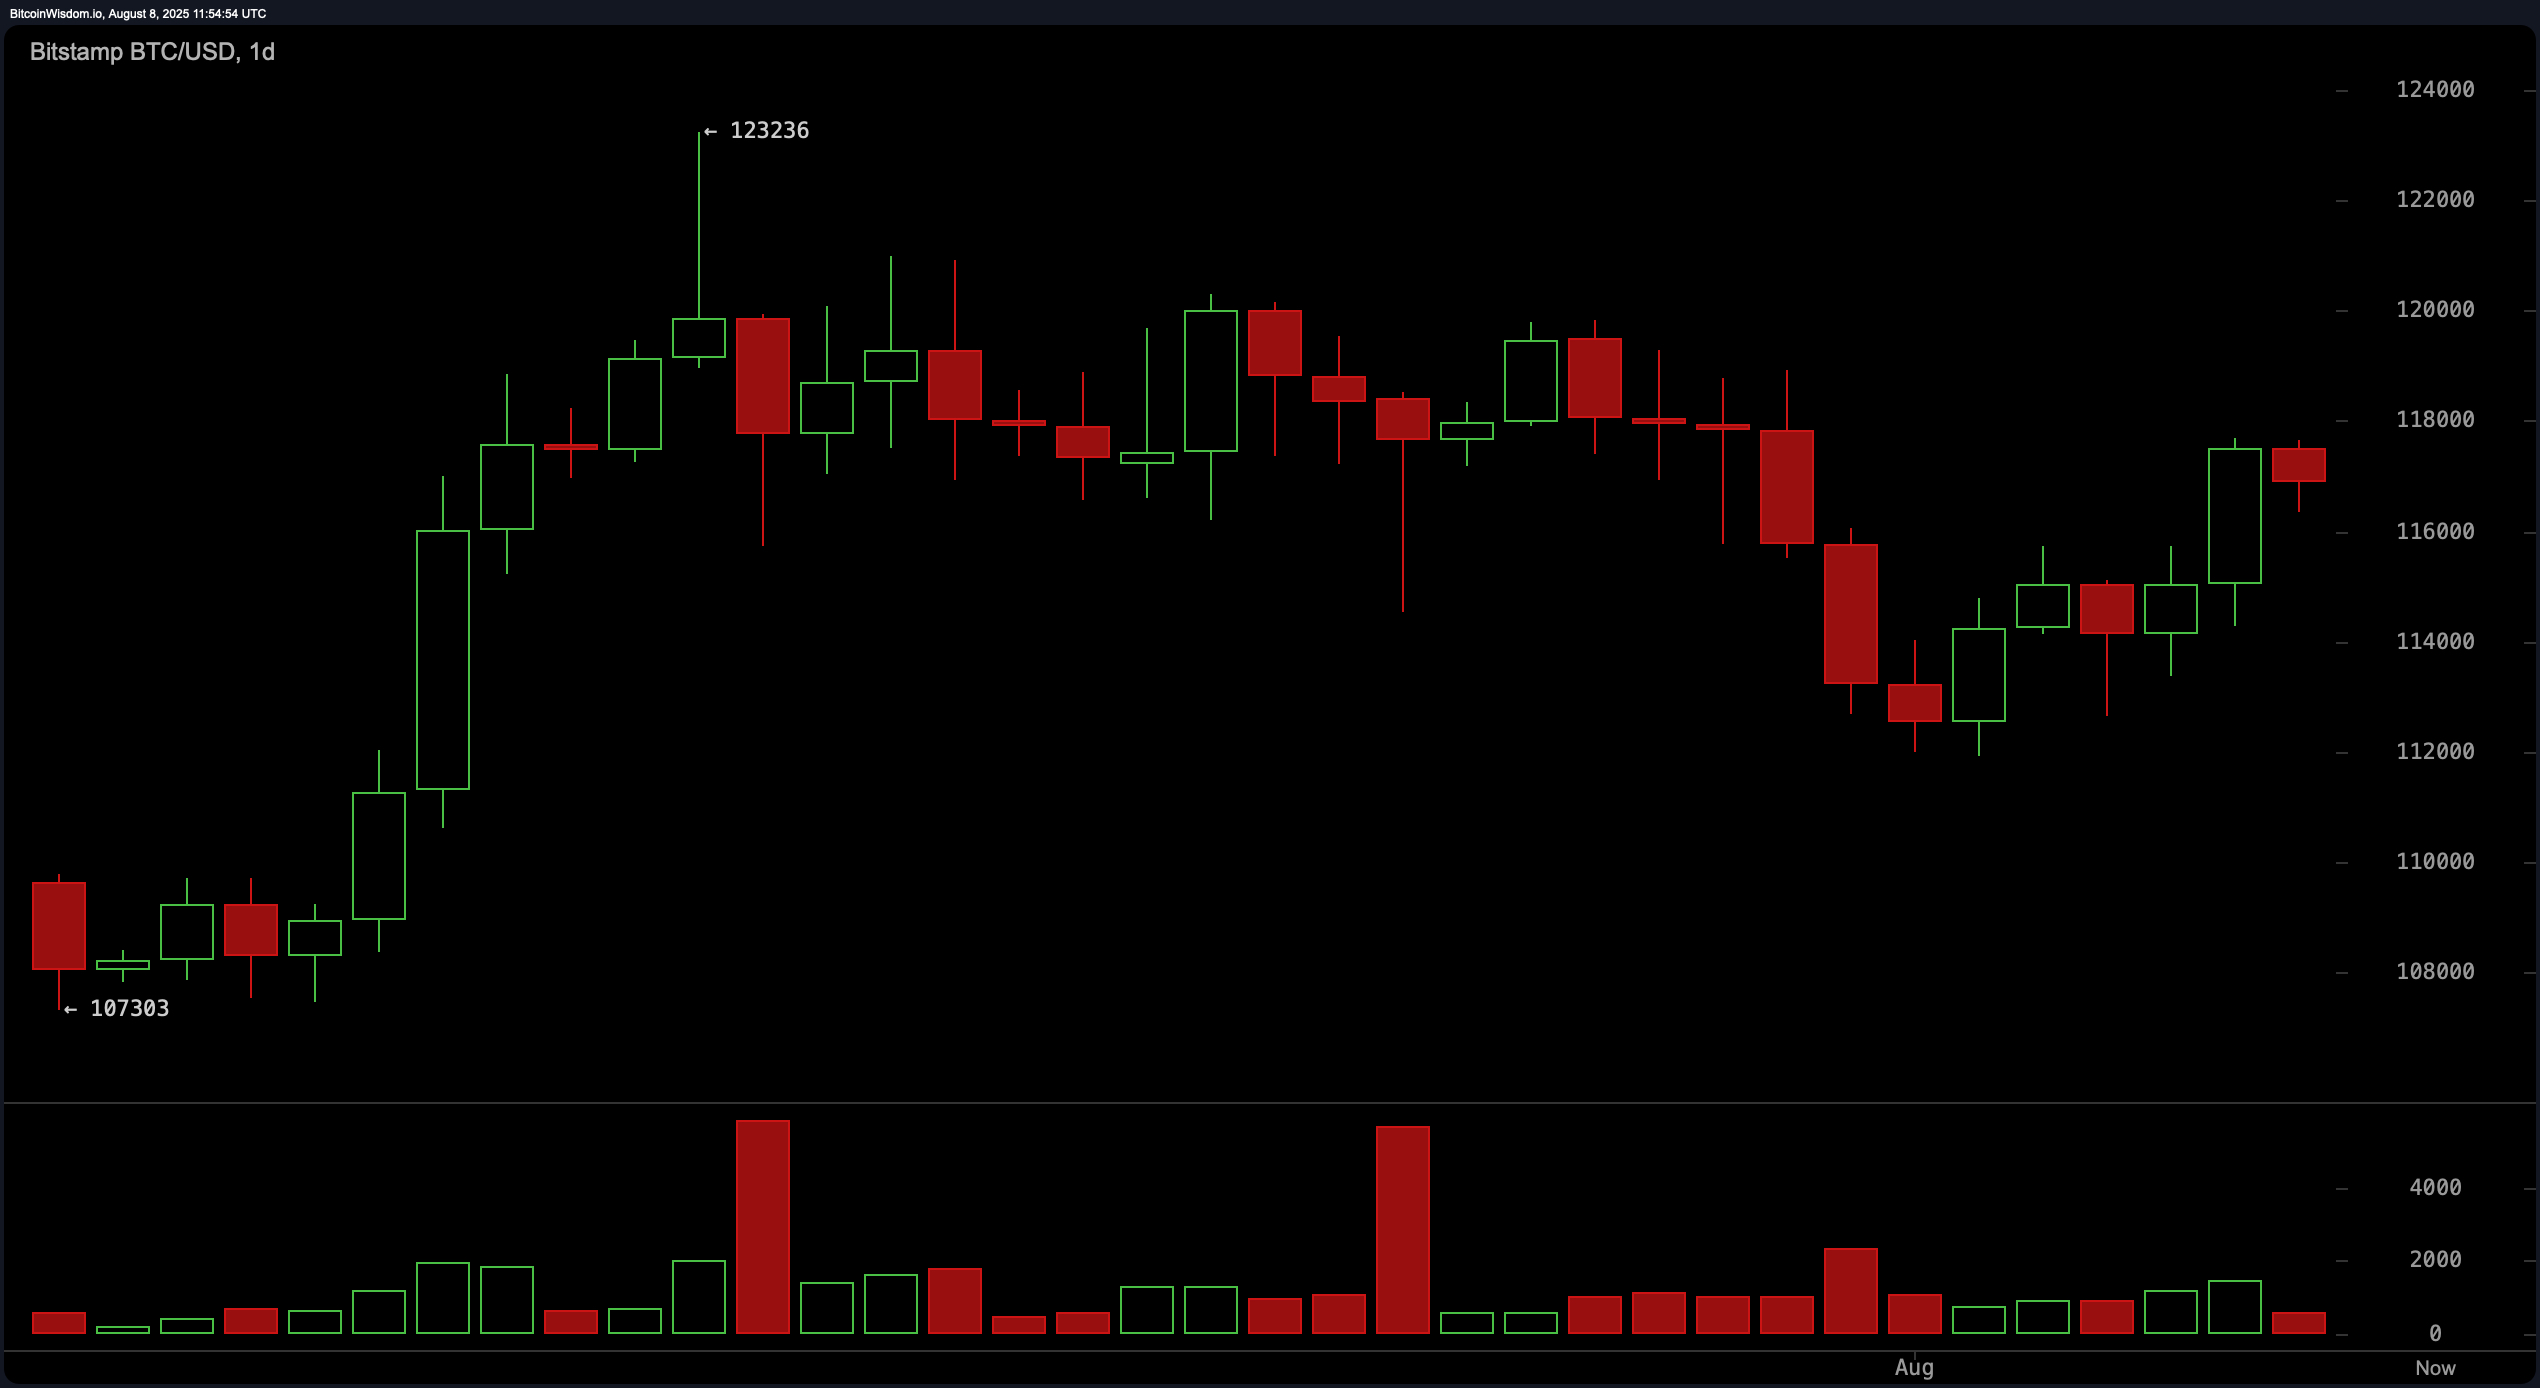
On the daily chart, bitcoin has rebounded sharply from the $112,000 level after correcting from its $123,236 peak, following a prior rally from the $107,300 zone. Price action shows sideways movement indicative of consolidation, with volume momentum lighter than during the initial bounce. The daily bias remains neutral-to-bullish as long as the $114,000 support holds, but a decisive move above $120,000 could reassert bullish dominance. Conversely, a drop below $114,000 risks triggering another leg lower toward prior support levels.
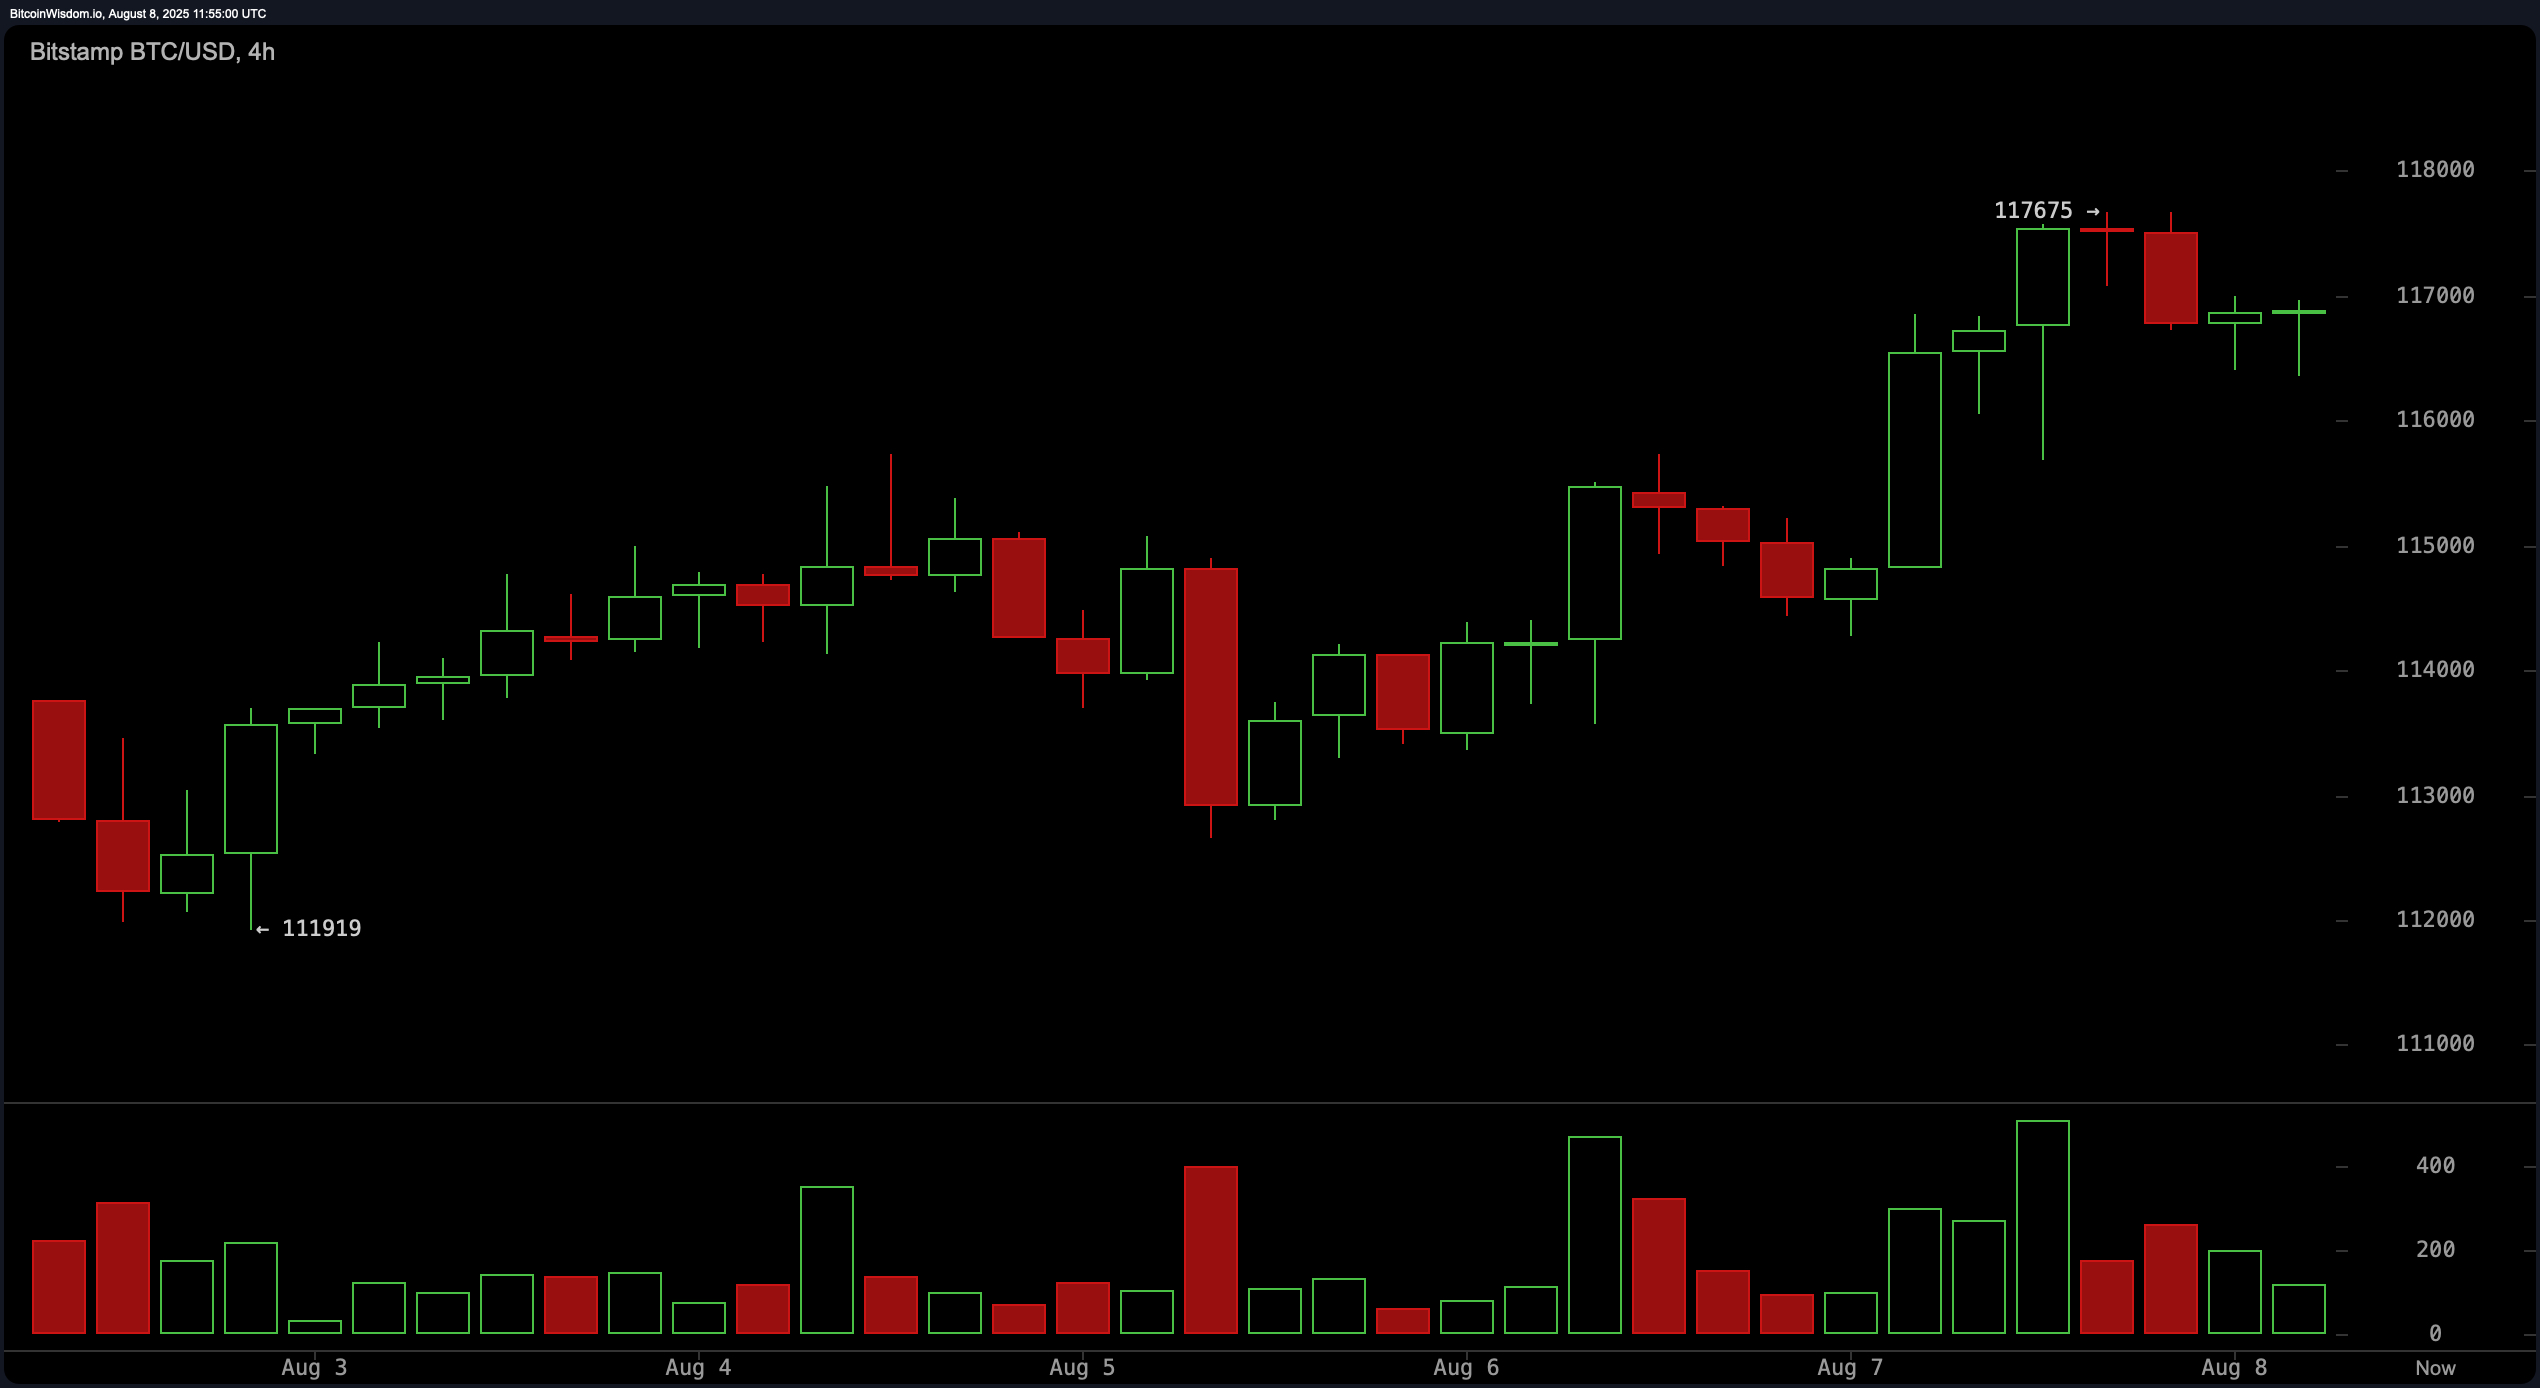
The 4-hour bitcoin chart reveals a steady climb from $111,919 to $117,675, with intermittent pullbacks that have not disrupted the broader uptrend. Price is consolidating near recent highs, and while volume has tapered, no significant selling pressure has emerged. Key support lies in the $116,000–$116,500 range, which could serve as a springboard for renewed gains if defended. A break below this level, however, could pave the way for a slide toward $114,500.
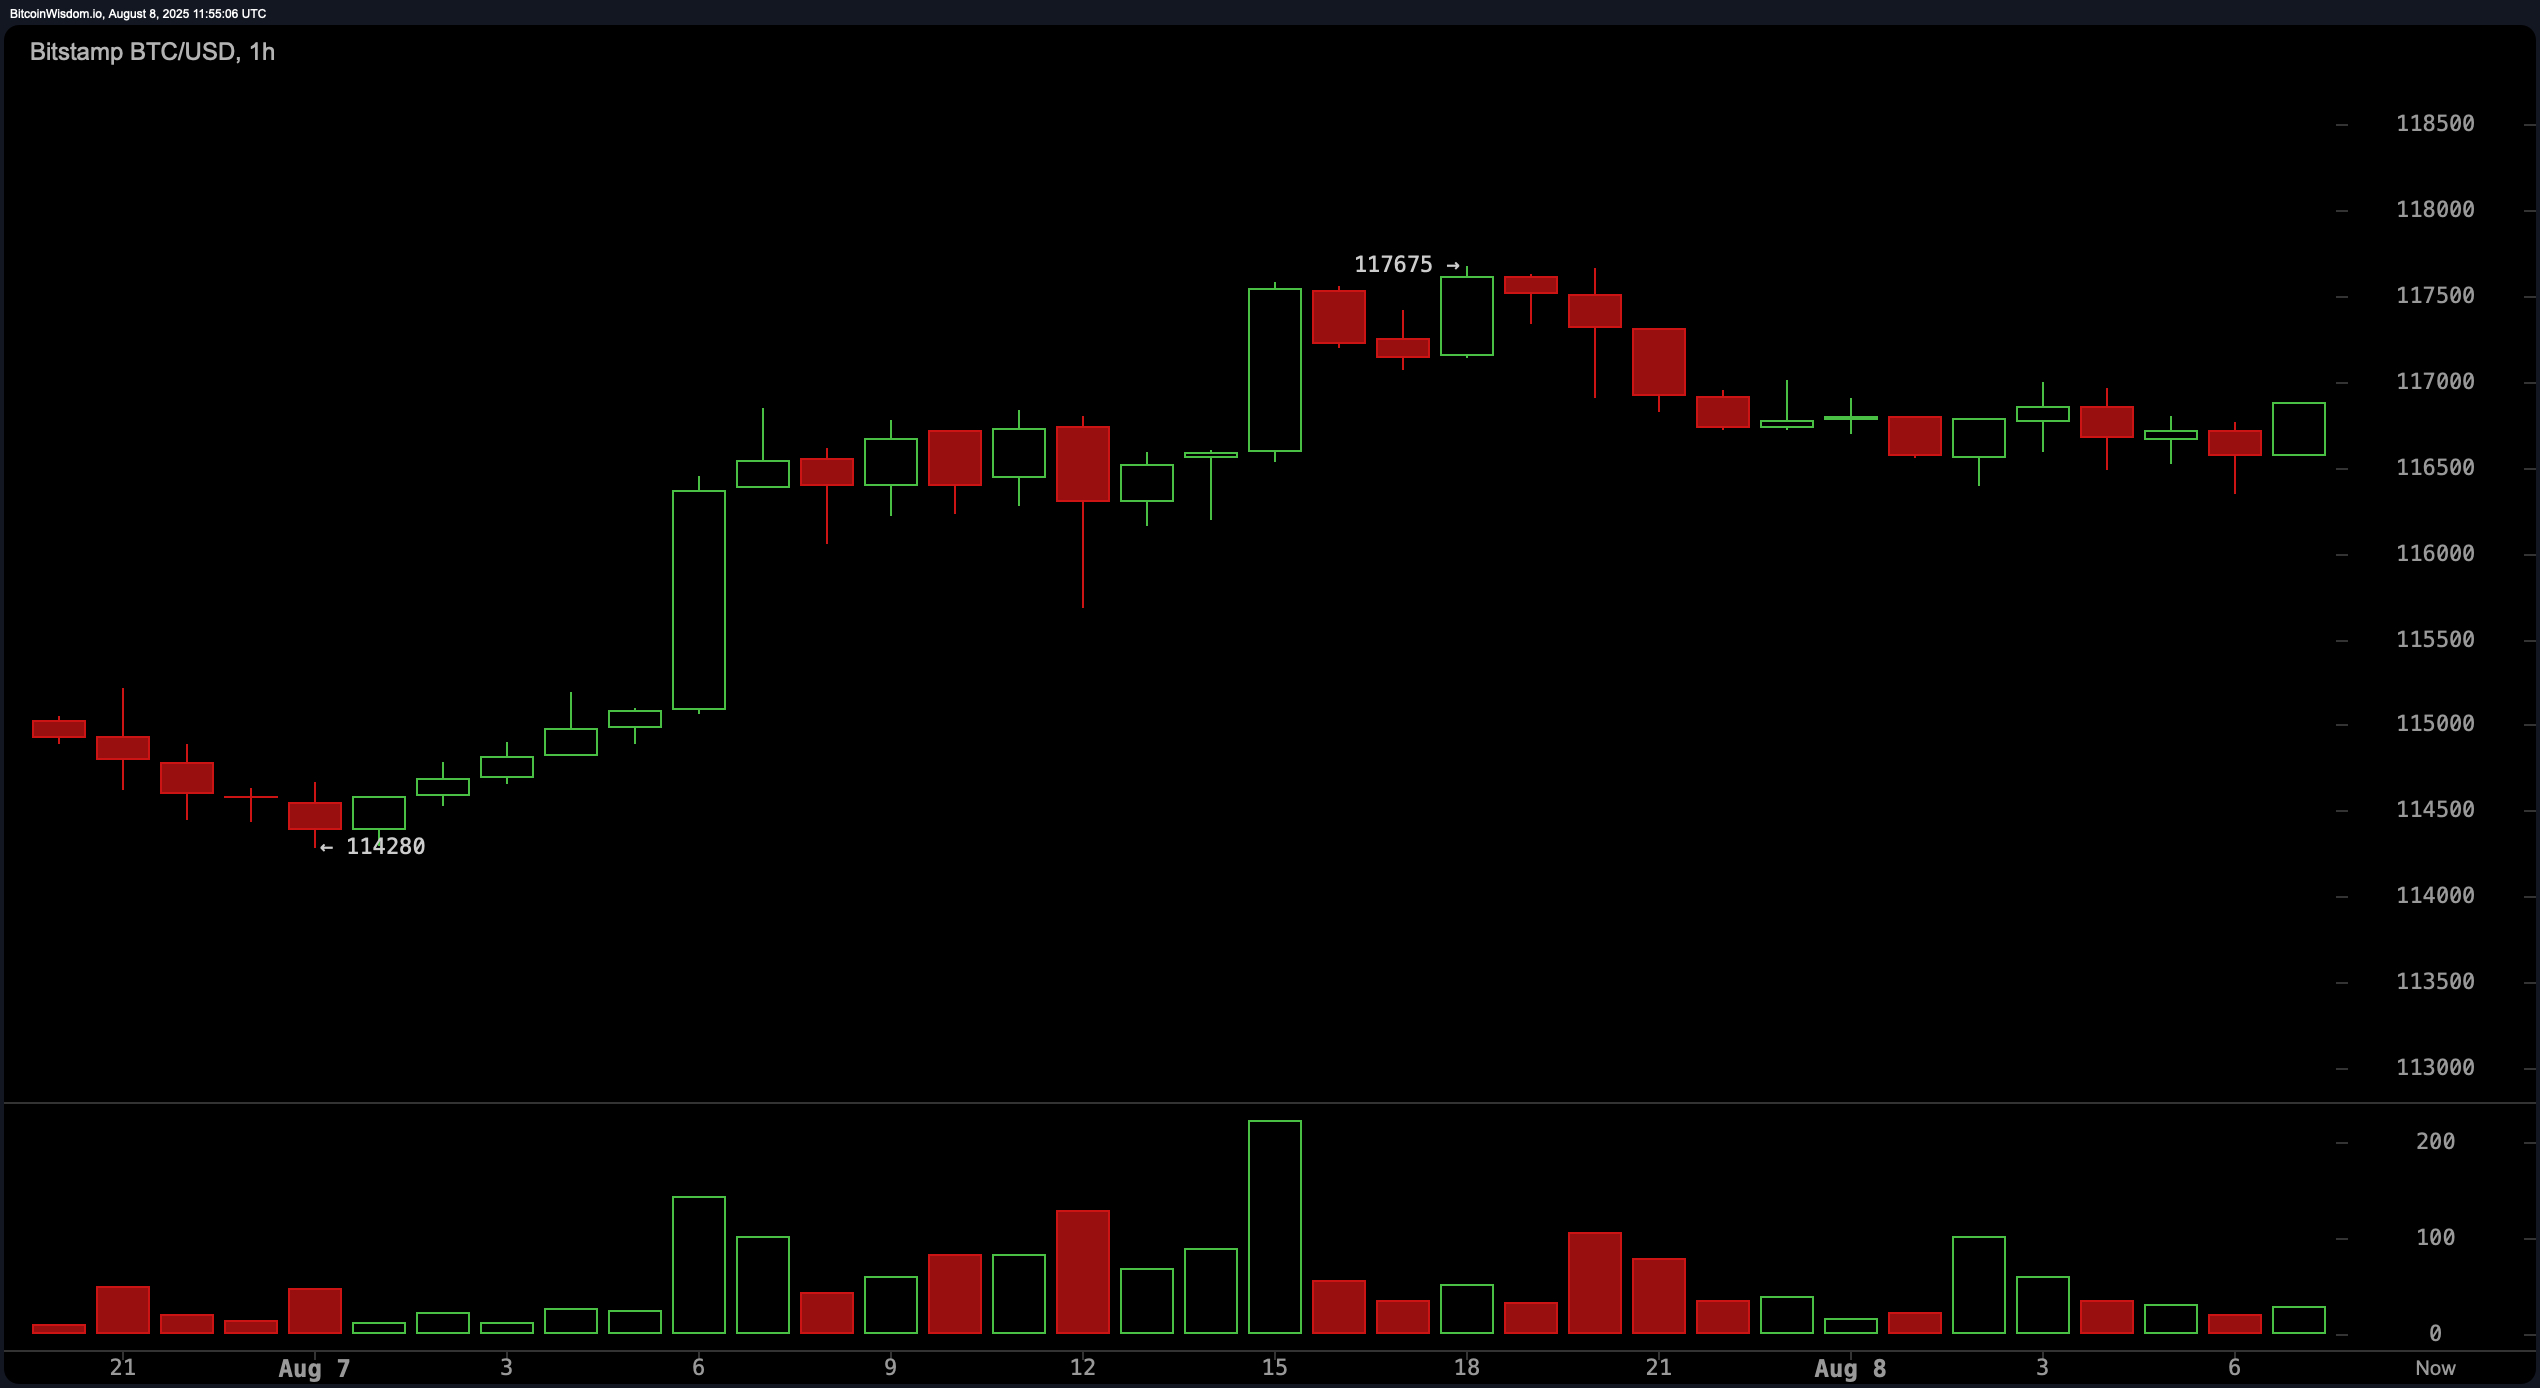
The 1-hour bitcoin chart illustrates a micro-uptrend from $114,280 to $117,675, followed by tight sideways trading as market participants await a catalyst. Declining volume suggests a volatility spike may be imminent. A breakout above $117,800 could prompt a push toward $118,500 or higher, while a breakdown below $116,500 might accelerate losses toward $115,000. This short-term indecision mirrors the broader consolidation structure visible on higher time frames.
Oscillator readings are mixed, with the relative strength index (RSI) at 54, stochastic at 58, commodity channel index (CCI) at 12, average directional index (ADX) at 17, and awesome oscillator at −878 — all registering neutral signals. However, momentum at −1,067 and moving average convergence divergence (MACD) level at 340 are both flashing bearish signals. This suggests underlying caution, even as price remains near the upper range of its recent consolidation.
Moving averages (MAs) display a predominantly bullish posture. The exponential moving averages (EMA) for 10, 20, 30, 50, 100, and 200 periods, along with the simple moving averages (SMA) for 10, 20, 50, 100, and 200 periods, are all in a bullish territory — except for the 30-period SMA, which has turned bearish. This alignment supports the view that bitcoin’s longer-term structure remains intact, with near-term weakness potentially offering accumulation opportunities if major supports hold.
Bull Verdict:
If bitcoin maintains support above $114,000–$115,000 and breaks decisively above $118,000 with rising volume, the path toward $120,000 and potentially higher remains open. Strong alignment in most moving averages underpins a bullish continuation scenario, with dips likely to attract buyers in the current macro uptrend.
Bear Verdict:
A sustained breakdown below $116,000 — and especially under $114,000 — would shift the short-term bias bearish, opening the door to a retracement toward $112,000 or lower. Mixed oscillator readings, coupled with weakening momentum and MACD sell signals, suggest that bulls could lose control if key supports fail.