- Bitcoin ($BTC) is currently trading within the $65.2K range.
- Neither buyers nor sellers drive a strong directional move.
The largest and dominant asset, Bitcoin ($BTC), is currently hovering within the $65,276 range. Also, the 24-hour trading volume is settled at $23.37 billion, down by 15%. That drop in volume during a rejection hints that conviction on the buy side is thinning out.
The .618 Fibonacci retracement level on the higher timeframes is stalling the downtrend and creating a reaction zone. $BTC’s downtrend has not reversed, but it has paused. That pause at a significant Fibonacci level is combined with other confluence indicators.
Where Will the Bitcoin Price Go From Here?
The short-term path of the asset points toward $64K as the next crucial support zone. That is the level that determines what happens next: either the Bitcoin price bounces from $64K and retests the highs, or it breaks through and opens the door to $61K, the major support below.
In addition, the $65.7K–$67K zone has been one of the most talked-about resistance confluences in the current range. Moreover, the multiple resistance layers stacked on top of each other in that zone made it difficult for the $BTC price to likely push through cleanly.
Is Bitcoin’s Technical Setup Lining Up for a Breakout or a Breakdown?
The Moving Average Convergence Divergence line is below the signal line, and the short-term momentum is slowing down. This setup shows a bullish trend that is currently undergoing a pullback. As both lines are above zero, the overall market direction is still bullish.
Traders wait for the MACD line to cross back up the signal line. If the lines keep falling below the zero line, it confirms that the broader uptrend of Bitcoin has broken down into a bearish trend.
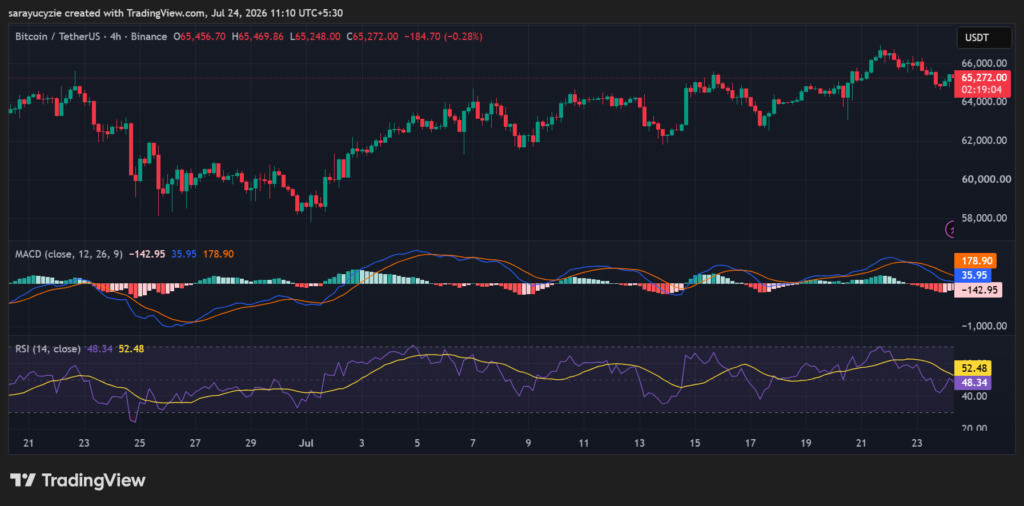
Furthermore, the daily Relative Strength Index (RSI) value is found at 48.34, indicating a neutral market with a slightly bearish tilt. The 50 level is the midpoint between bullish and bearish momentum. Neither the buyers nor the sellers are driving a strong directional move.
The asset is neither overbought (70) nor oversold (30). This is a consolidation or range-bound phase. A clean cross back above 50 is a bullish sign, or a drop toward 30 to spot potential oversold conditions.