Bitcoin ($BTC) could fall to $45,000 by early October 2026, according to an analysis that compares the current market cycle with previous crypto exchange failures.
The forecast comes as Bitcoin struggles to hold above the $65,000 mark despite a recent recovery in spot ETF inflows and improving market sentiment.
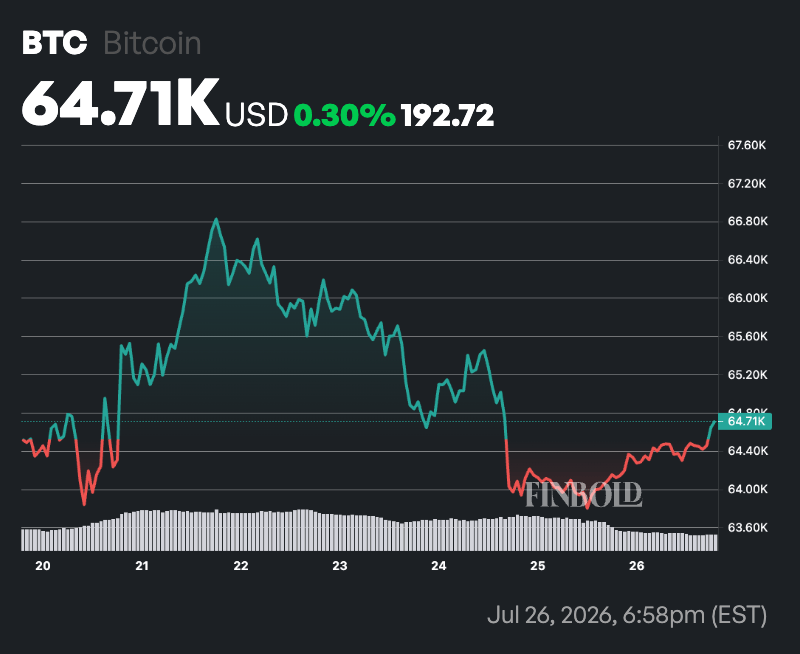
At press time, Bitcoin was trading at $64,710, up about 0.9% over the past 24 hours. On the weekly timeframe, the asset has risen 0.3%.
According to an analysis by TradingShot shared in a TradingView post on July 24, the latest major industry development, the planned shutdown of BitMEX after 11 years of operations, resembles earlier exchange collapses that occurred near major cycle lows.
The analysis notes that high-profile exchange failures have repeatedly occurred during bear market phases.
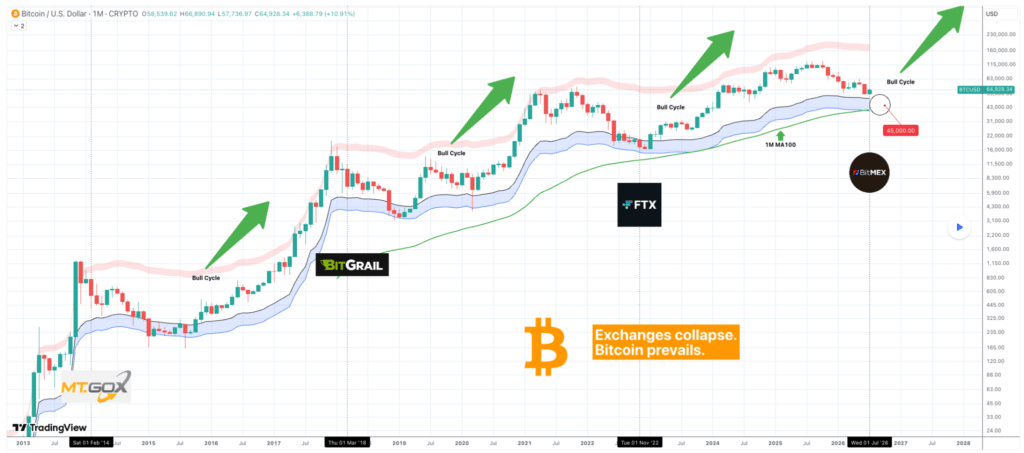
For instance, the collapse of Mt. Gox in 2014, BitGrail in 2018, and FTX in 2022 all coincided with periods of extreme market stress. In each case, Bitcoin eventually established a major bottom before beginning a long-term rally.
The latest comparison centers on BitMEX’s announced closure. TradingShot argued that the event may signal the current market cycle is approaching a similar capitulation phase.
The analysis shows Bitcoin trading just above its historical Realized Price Buy Zone, represented by a blue support band. Previous cycle bottoms formed within or near this area before substantial recoveries.
Bitcoin’s technical structure
Another indicator is Bitcoin’s rising 100-month moving average. The 2022 bear-market bottom formed just above this level, and the current setup appears similar.
Based on these signals, the analysis projects $45,000 as a potential downside target for early Q4 2026, with October emerging as a likely bottoming period.
However, the bearish outlook contrasts with improving institutional demand. U.S. spot Bitcoin ETFs recently recorded their strongest inflow streak of 2026, attracting nearly $1 billion and helping $BTC recover from lows near $58,000 earlier this month.
Bitcoin has since traded in the $64,000 to $66,000 range as investors weigh ETF flows, macroeconomic trends, and Federal Reserve policy expectations.
Bitcoin price short-term outlook
In the shorter term, analyst Ali Martinez, in an X post on July 25, highlighted $63,800 as a critical support level for Bitcoin on the four-hour chart.
According to the analysis, $BTC remains within an ascending channel and is currently testing the lower boundary. If $63,800 holds as support, Bitcoin could rebound toward $67,000, near the channel’s upper range.
Keep an eye on Bitcoin $BTC at $63,800.
If this level holds as support, I’m watching for a rebound toward $67,000. But if it breaks, the next downside target sits around $60,000. pic.twitter.com/kAn0hDIEmc
— Ali Charts (@alicharts) July 25, 2026
However, a decisive break below that level would weaken the bullish structure and open the door for a move toward $60,000, the next major downside target identified on the chart.
The setup suggests that while longer-term analysts are watching for a possible cycle low near $45,000 in early Q4 2026, traders remain focused on whether Bitcoin can defend the $63,800 support zone in the coming days.