- Bitcoin price has fallen to the $63K threshold.
- The rising wedge has broken down, handing control to bears unless $BTC recovers the trendline.
As of July 28, Bitcoin ($BTC) has dropped by 3.11% and is currently trading at $63,274. Also, the daily trading volume is up by 75% to $27.79 billion. This volume spike during a selloff is not a good sign for bulls. While $70K served as the primary benchmark just days ago, market attention has rapidly shifted toward whether the $63K support level will hold.
$BTC has broken below the rising wedge, a clean breakdown that hands control back to bears unless price reclaims the trendline quickly. The bounce that was present appears to be over, and the price closed below the trendline, backtested it, and resumed lower.
A bearish engulfing candle on top of that, with higher timeframes still trending bearish, does not leave much room for optimism in the short term. Moreover, the selling pressure of Bitcoin has been described by traders as unusually violent.
The Key Level That Will Decide Bitcoin’s Next Move
The $63K range is the line. Upon holding it, this likely turns into another shakeout before continuation higher. With steady bullish pressure, a golden cross could take place, and the bulls gradually send the Bitcoin price toward the nearest $63,389 resistance.
Conversely, losing that level brings $61K on the chart, as the next destination before any attempt at new highs. If the downside correction strengthens, the $BTC momentum triggers the emergence of the death cross. Eventually, the price would fall to the $60K support.
The next 24–48 hours are critical, as the $BTC chart has conflicting signals. Bollinger Bands are squeezing on the 3-day chart, the weekly 200MA has seen multiple closes above it, and bullish divergence signals are still developing. That compression precedes a major expansion move, but the direction of that move is being decided right now at $63K.
$BTC’s Technical Outlook: Further Breakdown or Reversal?
The Moving Average Convergence Divergence (MACD) line of Bitcoin is found below the signal line. The short-term selling pressure is moving faster. As both lines have crossed beneath zero, the overall macro trend is firmly bearish.
This is a strong bearish setup, with the sellers holding full structural control of the market. Traders view this as a clear continuation of a downtrend, making buying or going long risky until a bullish crossover occurs.
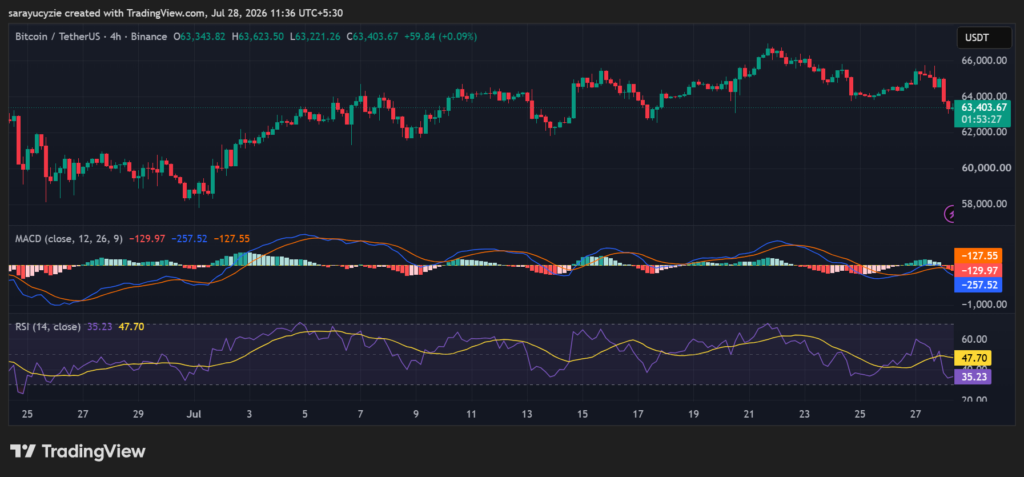
Besides, $BTC’s daily Relative Strength Index (RSI) at 35.23 hints at weak bearish momentum that is approaching. With the value below the neutral 50 level, the downtrend currently dominates short-term price action.
The asset is sliding closer to the 30 oversold mark, and this is a zone where price is in a downward drift before a decision point. It can drop below 30 for a potential bounce setup or reverse back above 40–50 to confirm selling exhaustion.