The Bitcoin [$BTC] short-term holder spent output profit ratio [STH SOPR] is at 1. In other words, coins held for under 155 days were, on average, at their cost basis. The taker buy/sell ratio showed a slight skew towards aggressive sellers, too.
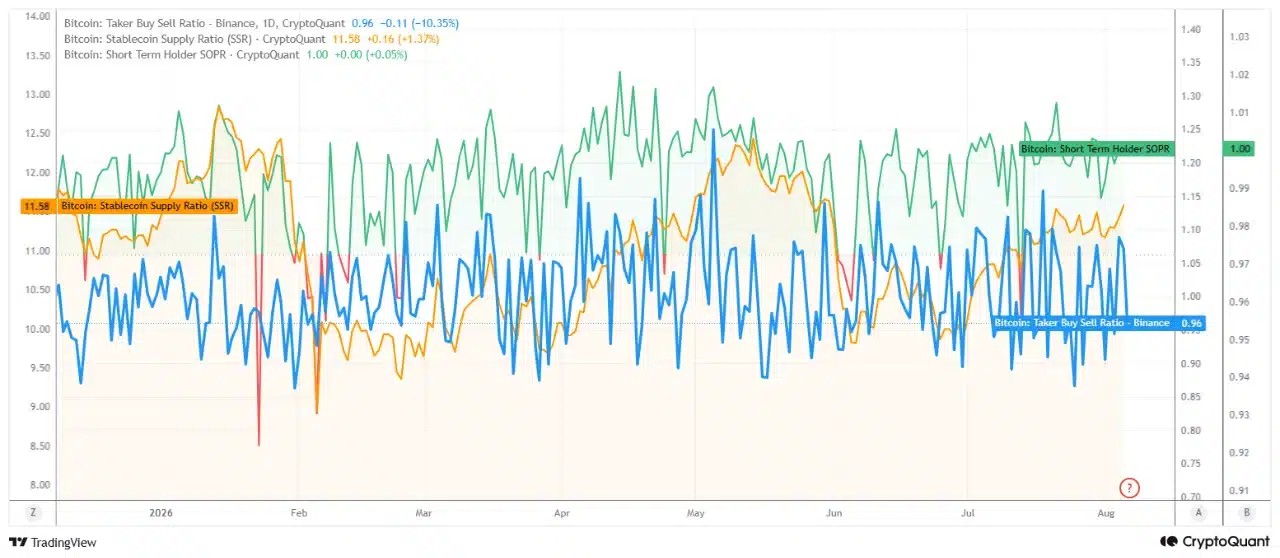
The stablecoin supply ratio measures Bitcoin’s market cap to the aggregate market cap of all stablecoins. This reading was at 11.58, showing stablecoin supply was relatively low and that buying power was still limited.
With these factors in mind, we can examine the sideways price action of the past two months. Bitcoin has oscillated between $60k and $66k since June, for the most part.
Demand for Bitcoin is not yet able to generate bullish momentum
AMBCrypto reported that the daily miner revenue from block rewards has dropped below $30 million by mid-July. Contracting revenues have put miners in a tight spot.
The Bitcoin supply with long-term holders was at record highs. This signaled strong HODLer conviction. Even so, fear lingered in the market.
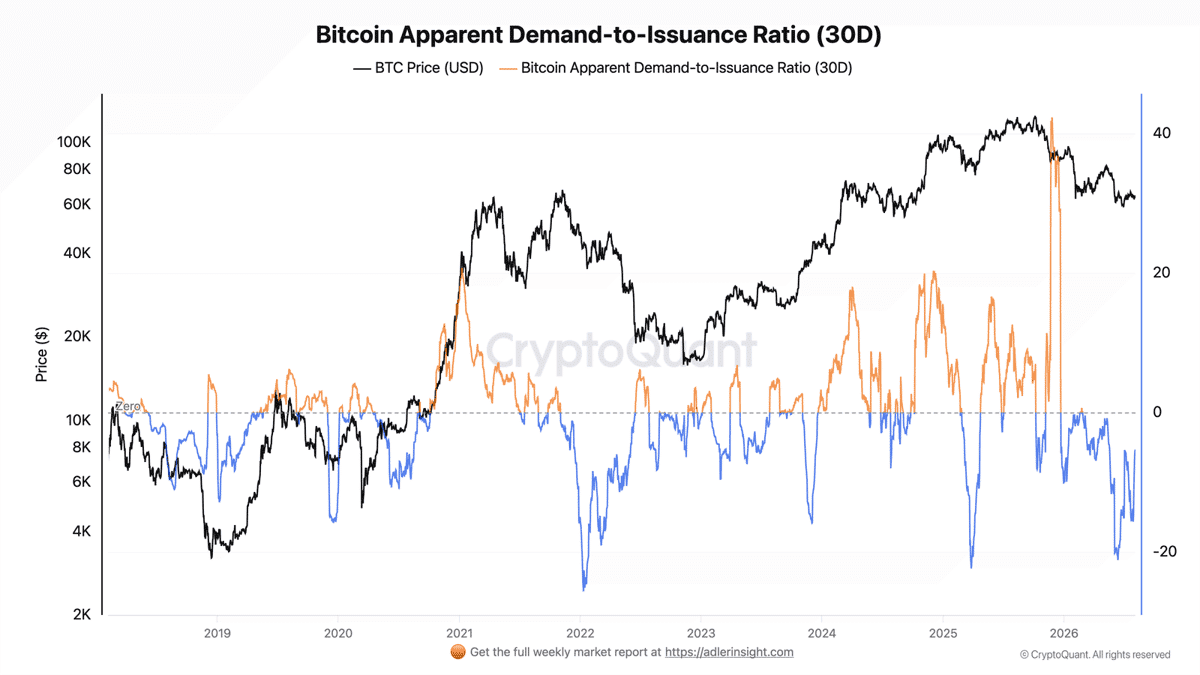
The apparent demand-to-issuance metric compares the 30-day change in the volume of coins less than a year old with new $BTC issuance. Readings above 1 indicate young coins are growing, while a reading below 0 shows this volume is shrinking compared to issuance.
Crypto analyst Axel Adler Jr. used this metric to demonstrate that the current price rebound is not accompanied by growth in the volume of young coins.
The metric was at -5.43 and has been negative for five months now. It made a low near -16 in July, so it has recovered a little. Overall, despite price hovering around $64k, apparent demand was too weak to confirm price recovery.
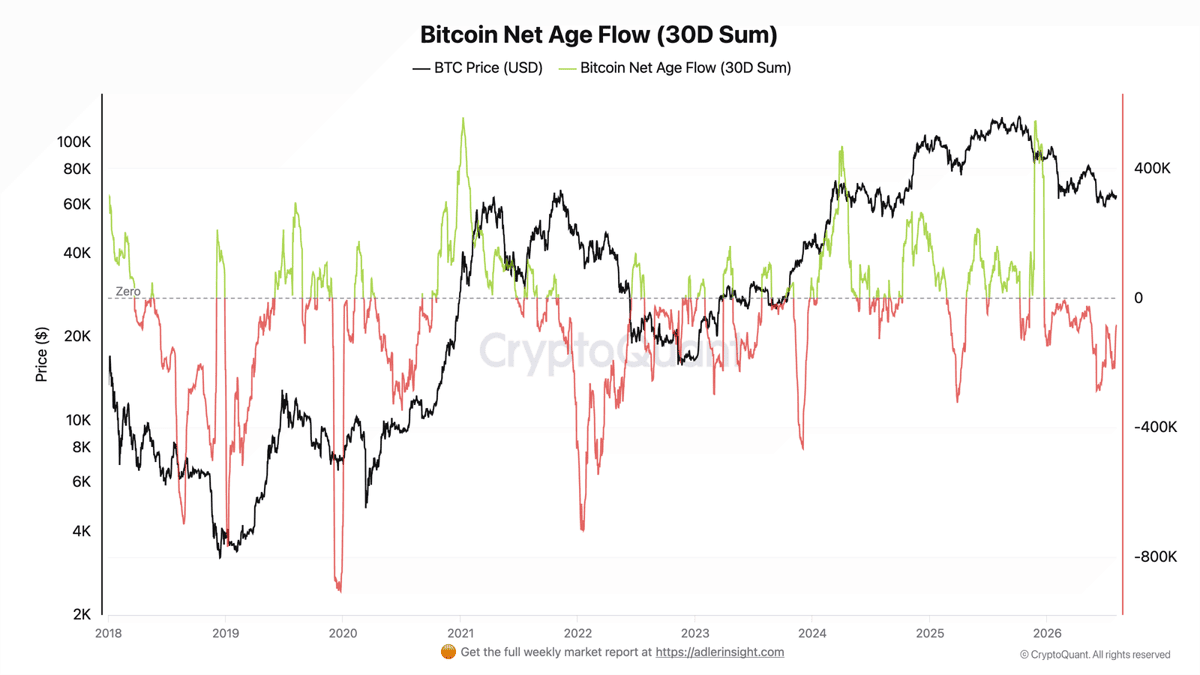
The metric above tracks the movement of Bitcoin between cohorts over 30 days old. A positive reading means more coins returned to young supply than moved into the over-one-year category.
The net age flow has been negative for seven months, and the current flow of -85.5k $BTC means 85.5k Bitcoin has moved from young coins into the over-one-year category.
This pattern indicates accumulation and reduced supply available for sale.
Taken together, the two metrics point to a market where existing holders continue accumulating, but new buyers have yet to arrive in sufficient numbers.
That combination helps explain why Bitcoin has remained range-bound despite improving long-term holder conviction.
If the Bitcoin net age flow turns positive, it would signal a short-term turnaround. A reading of above 1 in the demand-to-issuance metric would confirm renewed demand and bullish vigor.
Final Summary
- The Bitcoin market is forming a bottom, but confirmation of a bullish trend shift was not yet at hand.
- A reading of above 1 in the demand-to-issuance metric, combined with a positive shift in net age flow, would confirm a bullish regime shift for Bitcoin.