
Bitcoin’s price is trading at $118,400, with a market capitalization of $2.35 trillion and a 24-hour trading volume of $45.32 billion. The intraday range has been between $118,252 and $120,693, signaling a day of relatively contained volatility despite recent swings in momentum.
Bitcoin
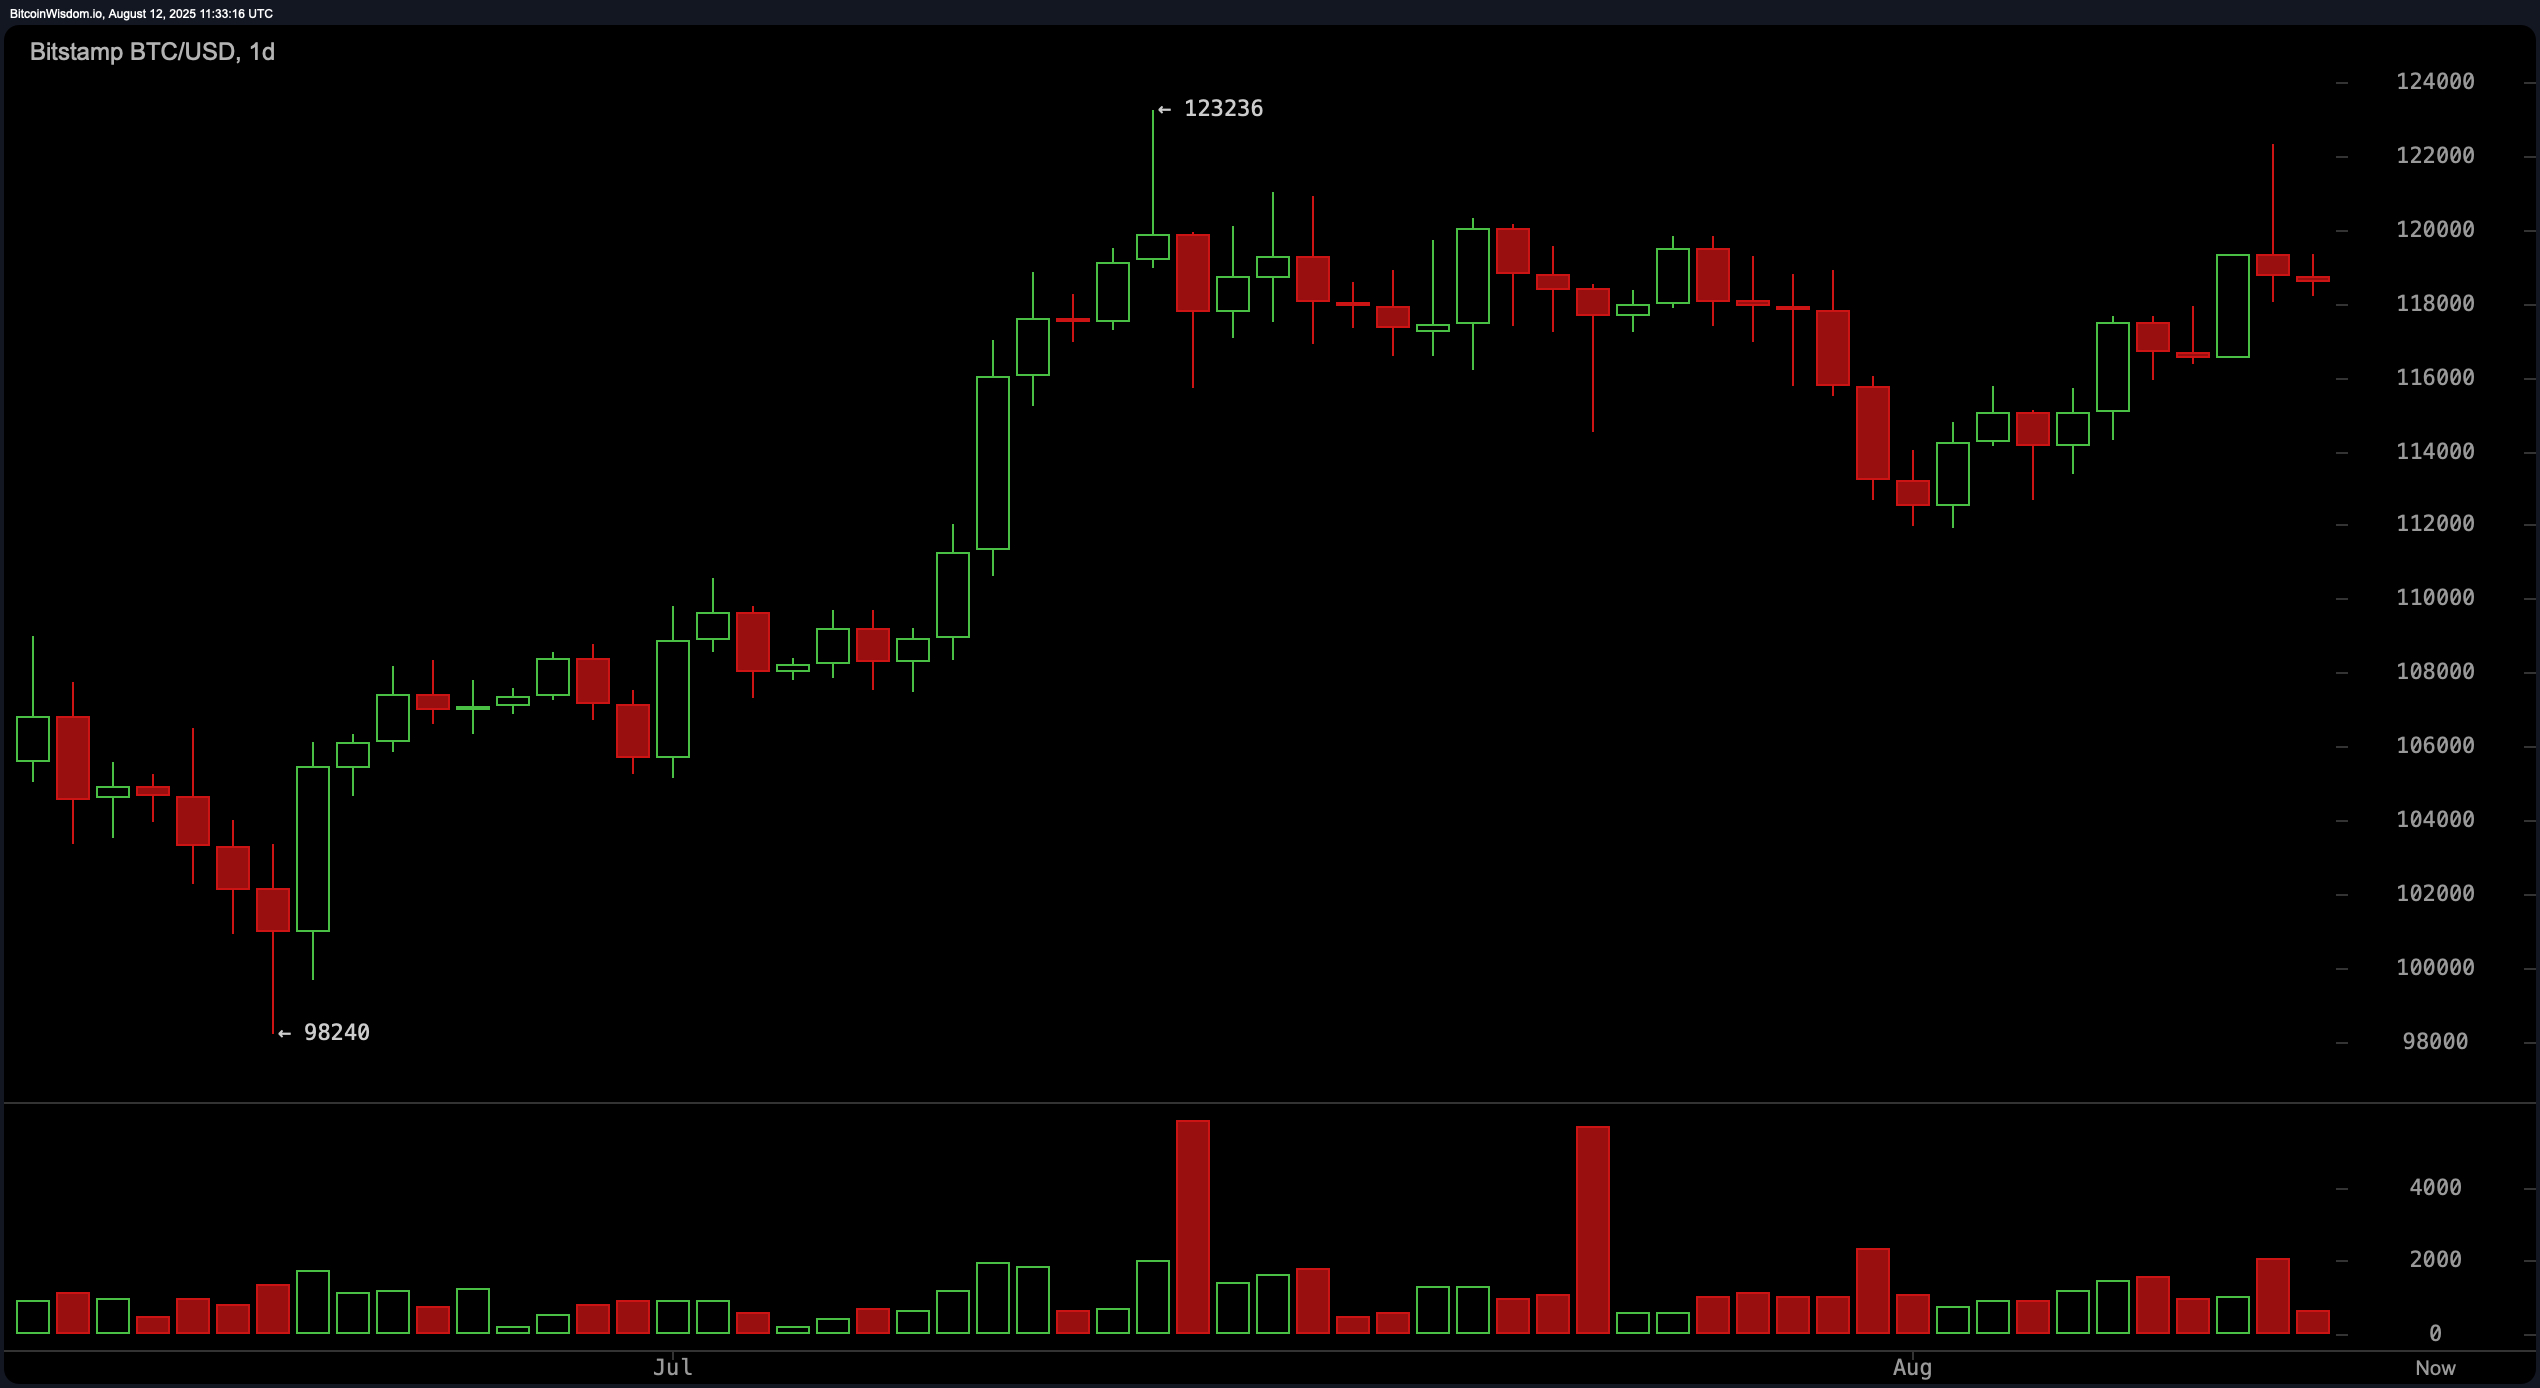
On the daily chart, bitcoin continues to display a bullish macro structure, carrying momentum from the rally that began in late June and peaked in mid-July. The market has since shifted into a sideways consolidation phase, with support established near $112,000 and resistance just below $122,000. The price action resembles a bullish flag formation, suggesting the potential for continuation if buying pressure returns. Volume has declined since the failed breakout in late July, which reinforces the idea of market participants waiting for a decisive move before committing heavily.
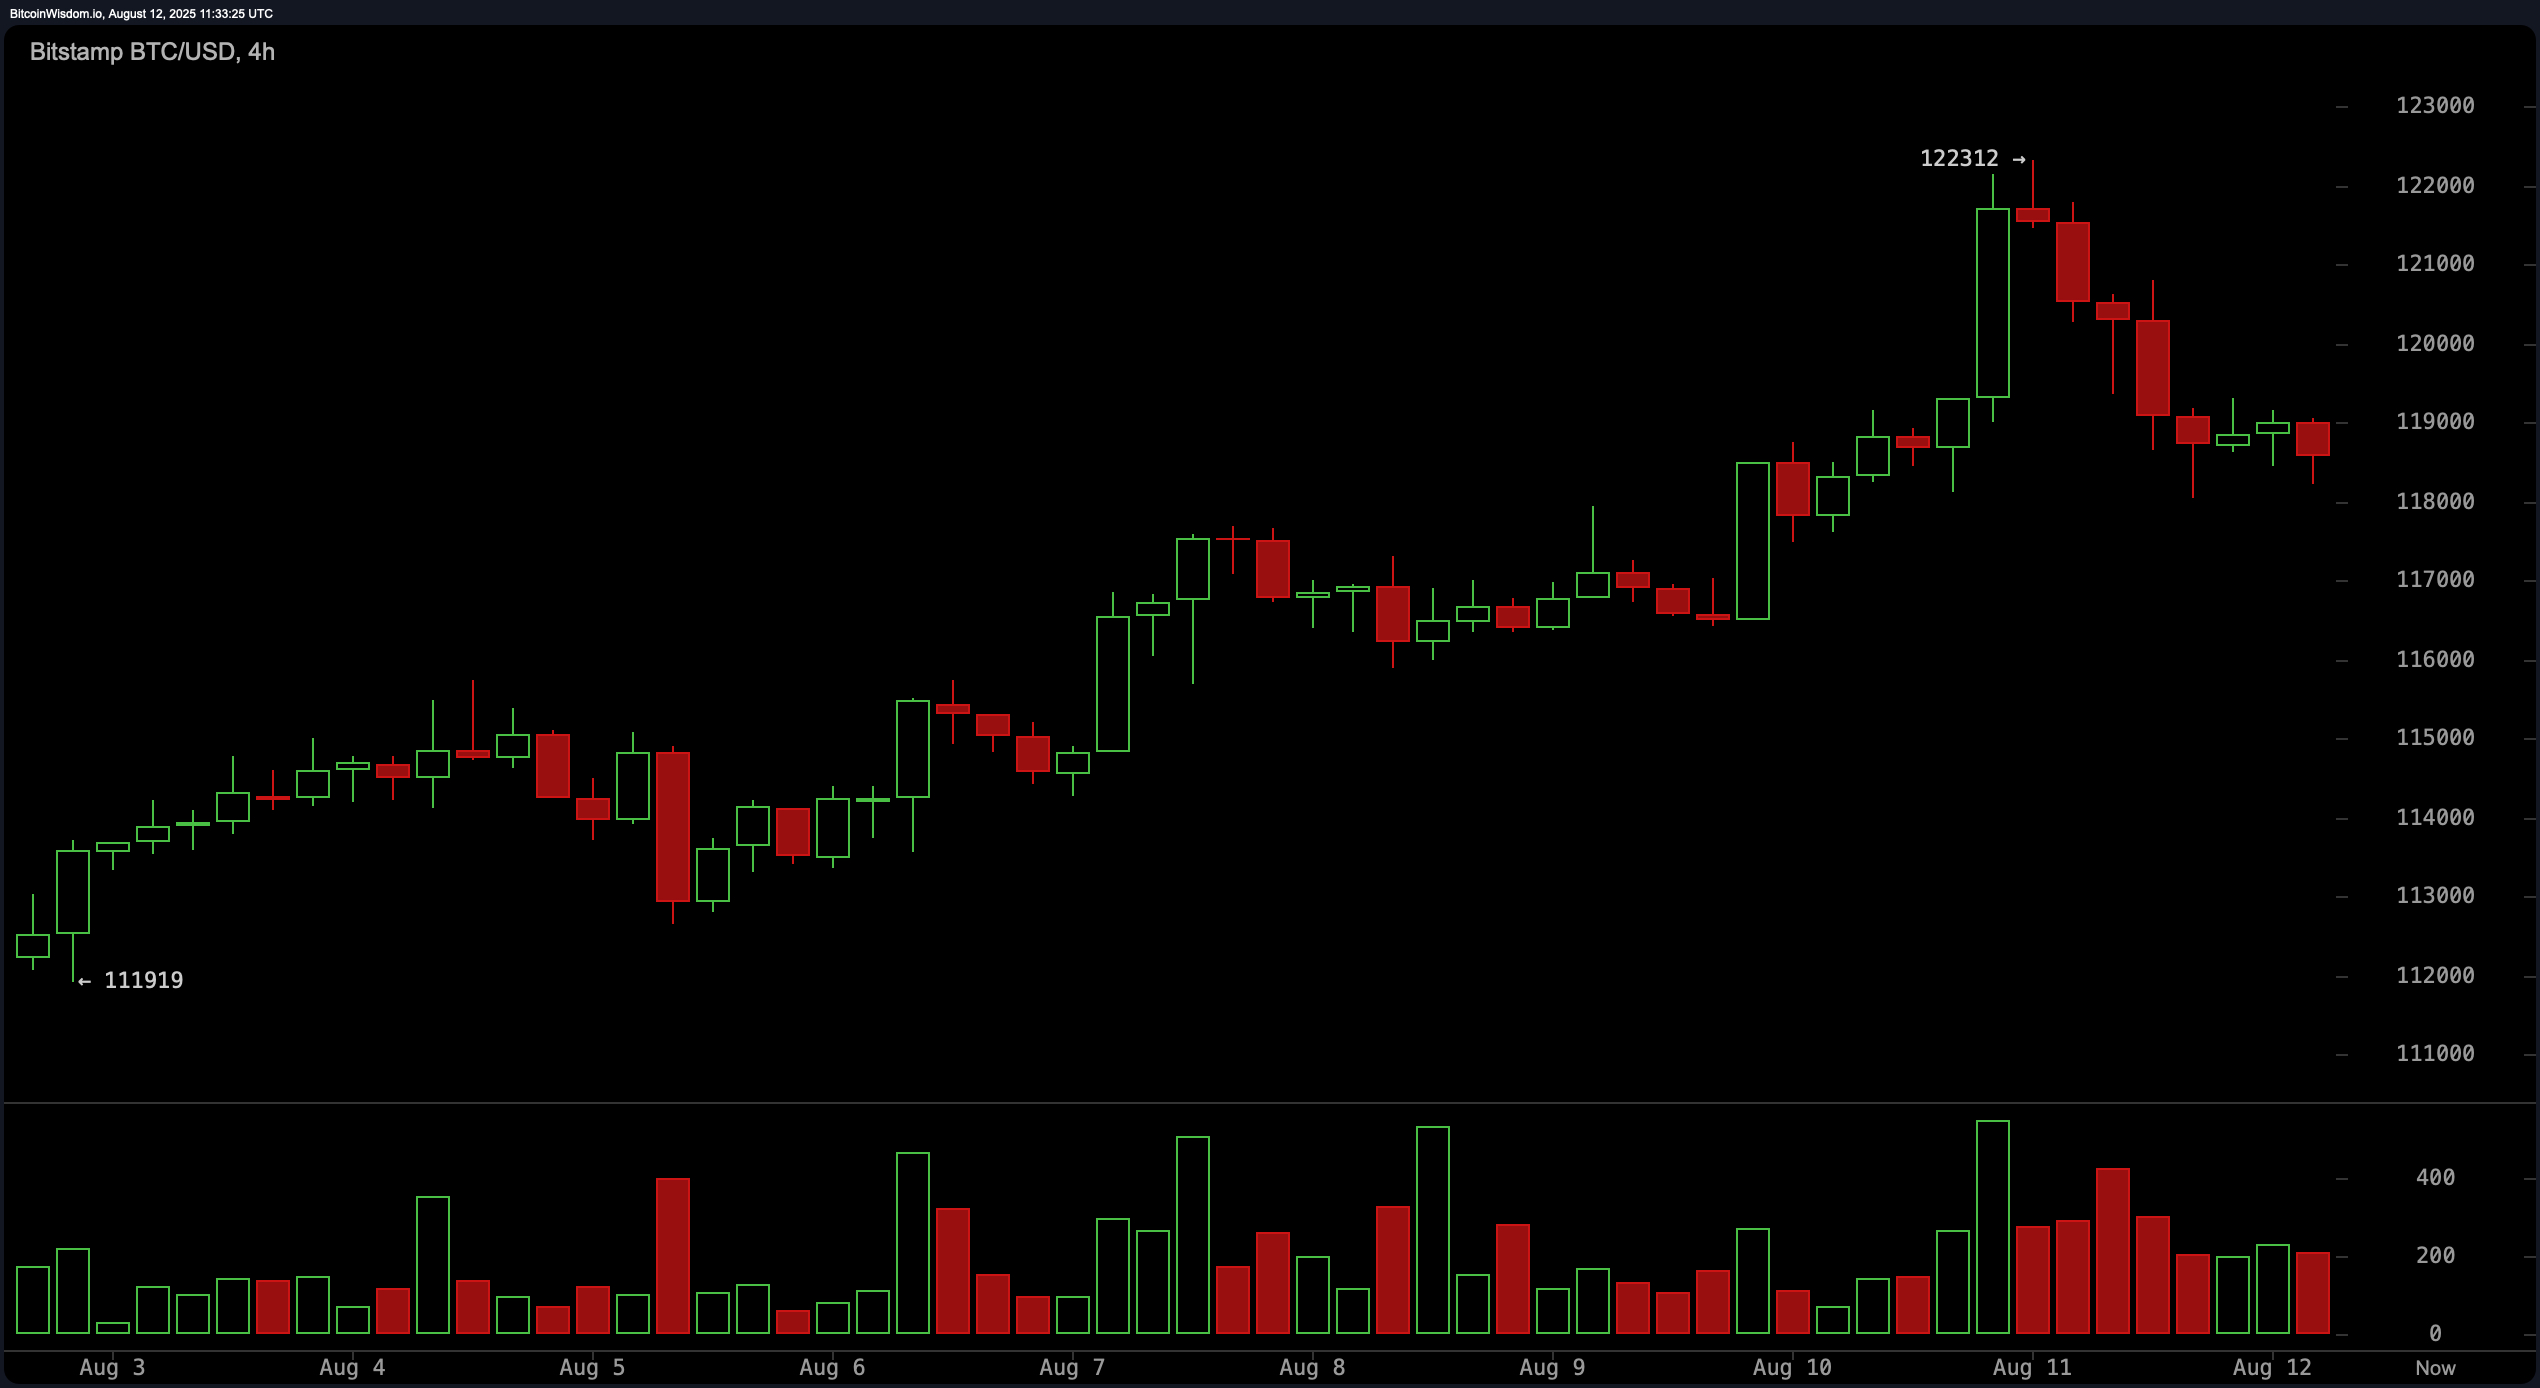
The 4-hour bitcoin chart reveals a strong short-term uptrend that began in early August, culminating in a peak of $122,300 on Aug. 11 before retracing. The pullback was met with heavy selling, confirming $122,300 as a significant resistance zone. The current technical picture shows consolidation near the $118,000 level, with a potential bullish trigger if the price can reclaim the $120,000 mark alongside an increase in green volume. Conversely, a drop below $117,000 could invite more selling pressure in the medium term.
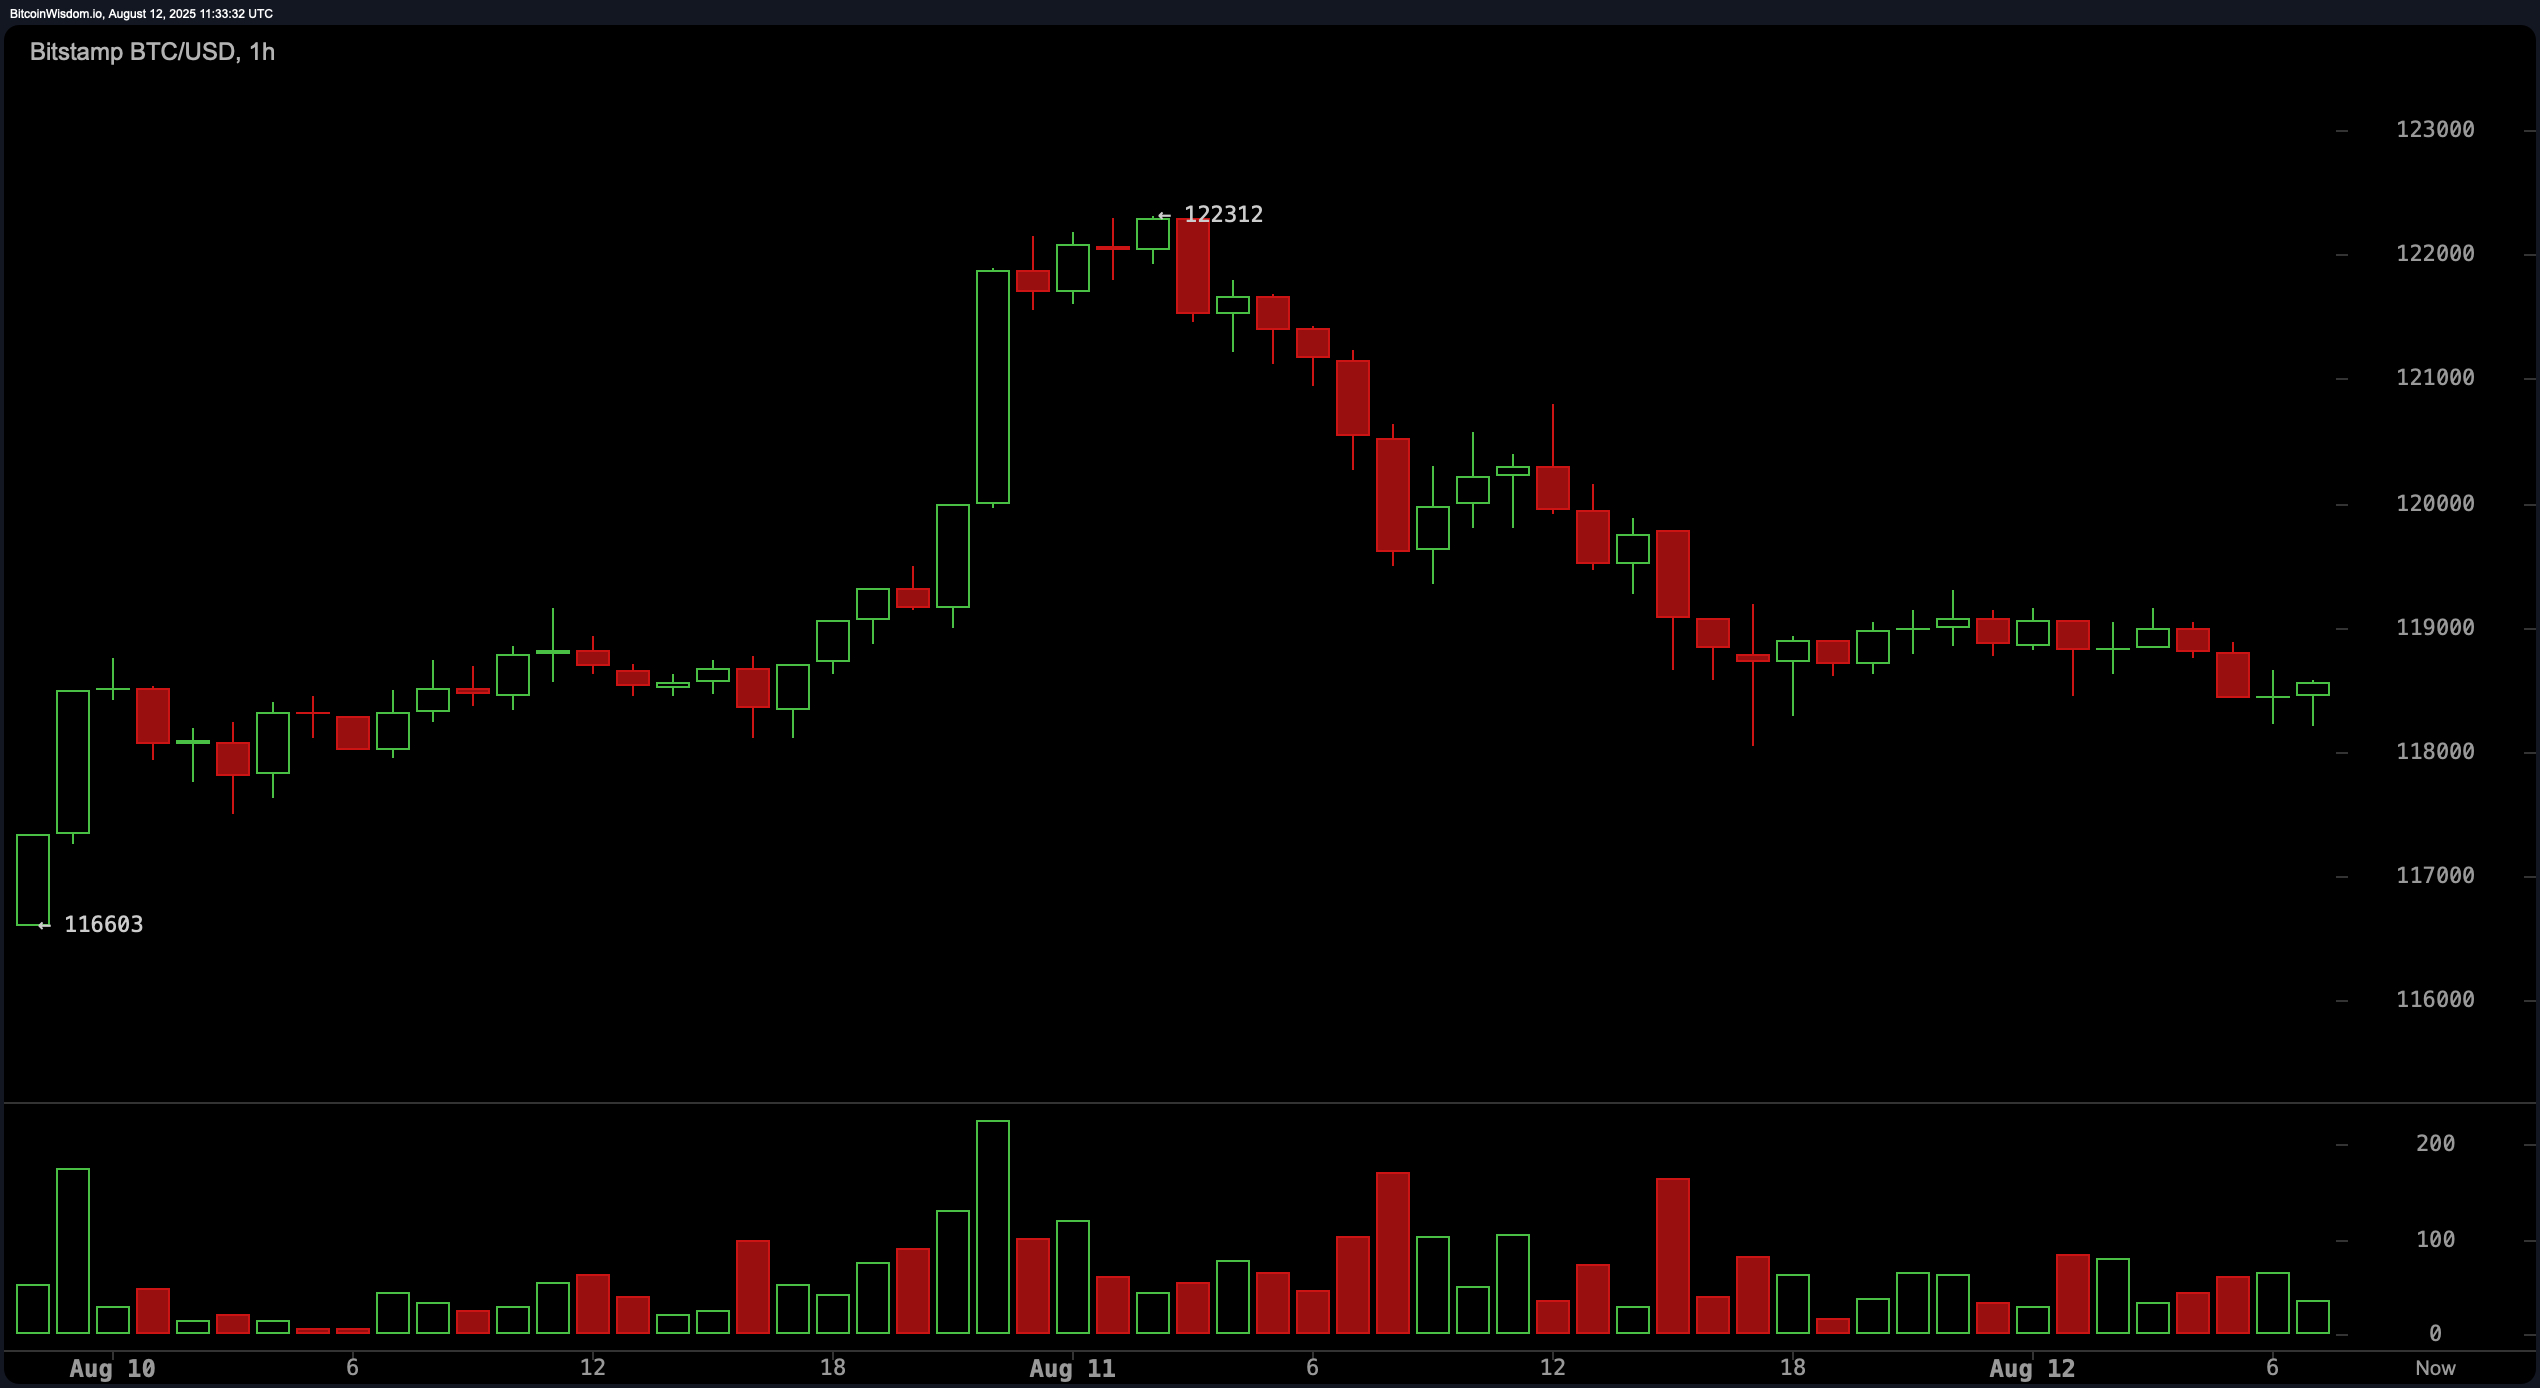
From a short-term perspective, the 1-hour bitcoin chart illustrates a controlled pullback from the recent top at $122,312, followed by stabilization around $118,000. Volume has diminished significantly since the sell-off, indicating that sellers have lost momentum while buyers remain cautious. A push above $119,000 with rising participation could offer a scalp or short-term long opportunity, while a break below $117,800 could accelerate downside momentum toward the next key supports.
Oscillator readings paint a largely neutral picture, with the relative strength index (RSI) at 58, stochastic at 74, commodity channel index (CCI) at 81, average directional index (ADX) at 18, and awesome oscillator at 892. However, momentum at 5,975 and the moving average convergence divergence (MACD) level at 794 both flash bullish signals, suggesting underlying positive bias despite the consolidation. This aligns with the overall macro uptrend, even if the short-term direction remains undecided.
The moving averages provide a strong bullish underpinning across all key periods. Both the exponential moving average (EMA) and simple moving average (SMA) from 10 through 200 periods signal bullish conditions, with shorter-term averages such as EMA (10) at 117,249 and SMA (10) at 116,563 reinforcing immediate support levels. Longer-term measures, such as EMA (200) at 102,005 and SMA (200) at 99,886, confirm that the broader trend remains decisively upward. This multi-timeframe alignment of moving averages strengthens the case for a continuation higher if resistance barriers are broken.
Bull Verdict:
Bitcoin’s technical structure remains supportive of further upside, with bullish alignment across all major moving averages and buy signals from both momentum and the moving average convergence divergence (MACD). If price can reclaim and hold above $120,000 on strong volume, the path toward retesting $122,000—and potentially breaking higher—remains open.
Bear Verdict:
Despite the underlying uptrend, recent failed breakout attempts and declining volume suggest buyer hesitation. A breakdown below $117,800 on heavy selling could invalidate near-term bullish setups, opening the door for a deeper pullback toward the $115,000–$113,000 support range.