Key takeaways
- Bitcoin trades near $63,567 on Friday after rebounding from support around $62,300.
- $BTC remains below its 50-day, 100-day and 200-day EMAs, preserving the broader bearish bias.
- The RSI at 46 and a negative MACD signal weak momentum despite the recent stabilization.
Bitcoin ($BTC) shows signs of stabilization on Friday after recovering from a correction earlier in the week.
$BTC trades around $63,567 after buyers defended the $62,300 support level on Thursday. Holding this area could provide the foundation for a short-term rebound, but the price remains below all its major Exponential Moving Averages (EMAs).
Weak momentum indicators and several resistance barriers above the current price suggest that any recovery may remain limited unless Bitcoin reclaims the $64,488–$66,604 region.
Bitcoin rebounds from $62,300 support
Bitcoin found support around $62,300 on Thursday before recovering to approximately $63,567 on Friday.
The rebound indicates that buyers remain active near the lower boundary of the current range. However, $BTC continues to trade below the 50-day, 100-day, and 200-day EMAs, which are positioned between $64,488 and $72,035.
When the price trades below these major moving averages, they can act as dynamic resistance during recovery attempts. This structure suggests the broader trend remains bearish despite Bitcoin’s ability to defend short-term support.
A stronger reversal would require $BTC to reclaim the 50-day EMA before challenging the higher resistance levels created by the longer-term averages.
Bitcoin’s Relative Strength Index stands near 46, below the neutral level of 50.
The reading indicates that sellers maintain a slight advantage, although the indicator remains well above oversold territory. A move above 50 would suggest improving momentum and could reinforce the likelihood of a broader recovery.
The Moving Average Convergence Divergence remains below its zero line, supporting the bearish outlook.
Together, the indicators show that downside pressure has eased but has not disappeared. Bitcoin needs stronger buying volume and a decisive move above nearby resistance to confirm a momentum shift.
$BTC faces resistance at $64,488
The 50-day EMA at approximately $64,488 represents Bitcoin’s first significant resistance level.
A daily close above this moving average could strengthen the rebound and allow $BTC to challenge the 38.2% Fibonacci retracement level near $65,547.
Beyond that, the horizontal resistance at $66,500 and the 100-day EMA at $66,604 form a dense supply zone. Sellers may defend this region aggressively, particularly after Bitcoin’s recent correction.
If buyers overcome the $66,500–$66,604 range, the 50% Fibonacci retracement near $67,940 would become the next upside target.
A sustained move above $67,940 would substantially improve the short-term technical outlook, although the 200-day EMA near $72,035 would remain a major long-term barrier.
On the downside, initial support sits at the 23.6% Fibonacci retracement level around $62,586.
The horizontal floor at $62,300 provides the next and more critical support. This level triggered Thursday’s recovery and remains essential to Bitcoin’s short-term outlook.
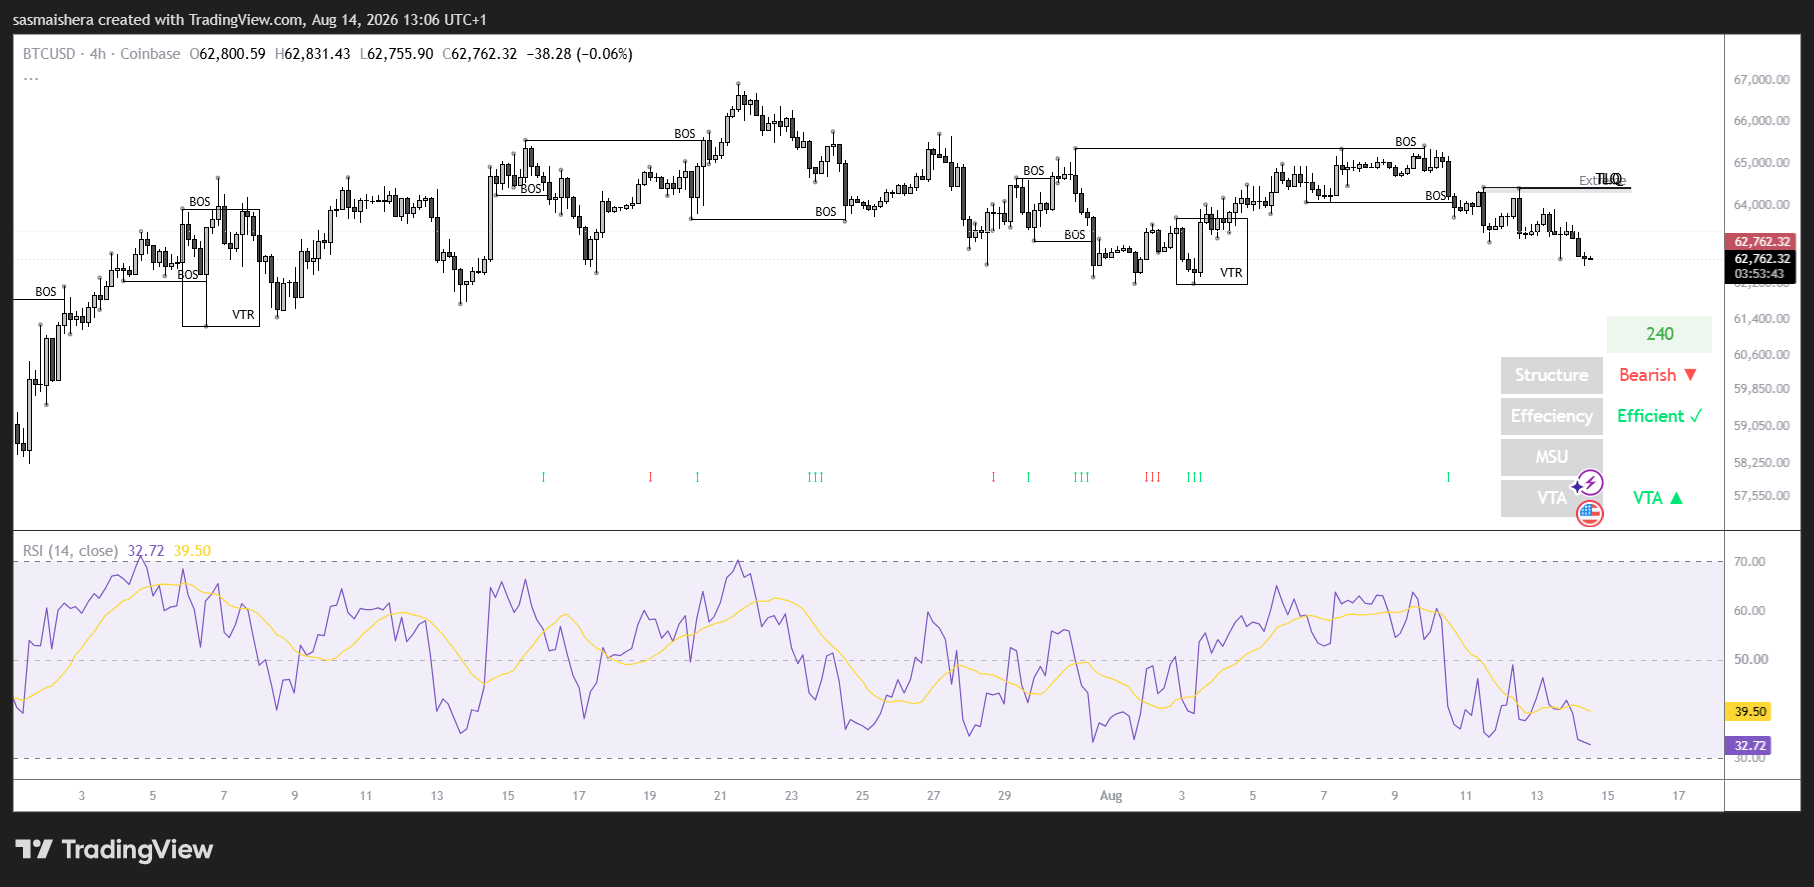
A daily close below $62,300 would invalidate the immediate rebound scenario and signal that selling pressure is strengthening.
Such a breakdown could expose Bitcoin’s broader support near $57,800, which marks the current cycle low. Buyers would likely attempt to defend this area because a sustained move below it could extend the wider bearish trend.
For now, holding above $62,300 keeps the possibility of a recovery toward $64,488 and $65,547 intact. However, Bitcoin must reclaim the major moving averages to demonstrate that bulls are taking control.