- The Bitcoin ($BTC) price is currently trading around the $75.2K mark.
- Short-term buying pressure is accelerating, and the overall market is controlled by buyers.
As of August 21, the dominant asset, Bitcoin ($BTC), has climbed back above $75,000, marking a notable shift in momentum. It has broken its nine-month downtrend. At press time, the price trades at $75,225, up over 8.3% in value, while its 24-hour trading volume reached $60.27 billion.
Bitcoin has moved between $69,320 and $75,527 over the past 24 hours, reflecting the strength within the market. Moreover, there was a substantial support zone between $61,849 and $63,111, where more than 2 million $BTC were previously transacted. This area could provide a strong foundation if it enters a period of consolidation.
$75K Breakout Puts the Momentum in Focus
$BTC has now reached the $75K resistance area after a steep vertical rally. While the broader structure has improved, the pace of the move raises the possibility of sideways consolidation before another leg higher.
Also, the URPD data shows limited resistance above current levels. If Bitcoin decisively clears $75,733, the next significant supply cluster appears around $83,307-$84,569, where 1 million $BTC previously changed hands.
The breakout has also intensified pressure on short sellers, with liquidations adding to the current market volatility. If buyers can absorb the overhead supply, Bitcoin could enter a new price-discovery phase, making the $75.7K level an important zone for the next stage of its momentum.
Bitcoin is Bullish as Technical Indicators Rocket
The $BTC/USDT pair’s Moving Average Convergence Divergence line is above the signal line. The gap between the lines is large; the histogram bars are unusually tall. This means short-term buying pressure is rapidly accelerating. As both lines are above zero, the overall market is firmly controlled by buyers.
The momentum is extremely strong, with an aggressive bullish signal, confirming an uptrend with surging short-term momentum. If the gap between the MACD and signal line stops expanding, it might precede a consolidation phase.
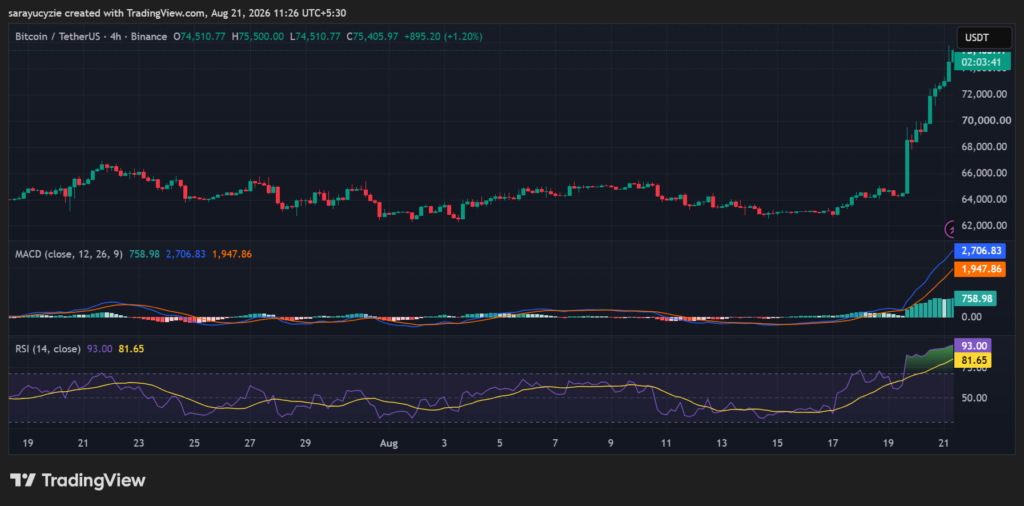
Bitcoin’s daily Relative Strength Index (RSI) value of 93 is an extreme overbought state. It is one of the highest possible momentum readings, signalling an extraordinarily aggressive buying wave. The price action has moved upward with virtually no pullbacks to cool down the indicator.
Notably, in its current condition, it likely precedes a temporary exhaustion point, where the asset must drop significantly to reset the technical indicators. Furthermore, this juncture for the asset carries significant short-term risk.