Bitcoin crossed $80,000 on Aug. 25 for the first time in almost 15 weeks, extending one of its strongest short-term advances since 2021.
The cryptocurrency traded near $80,500 at press time, according to the crypto.news market data. It reached an intraday high above $81,000 after gaining roughly 28% over eight days.
The advance has added approximately $350 billion to Bitcoin’s market capitalization, based on the price change and circulating supply. Bitcoin has also recovered about 38% from its July 1 low near $57,700.
That rebound effectively erased the losses accumulated since May. However, the crypto has now entered a resistance area that previously attracted heavy selling.
Bitcoin price tests resistance between $80,000 and $82,000
The daily $BTC/USDT chart shows Bitcoin testing resistance between $80,000 and $82,000. That area marks the upper boundary of its May trading range and represents the immediate test for buyers.
A sustained close above $82,000 would confirm that demand remains strong after the rapid recovery. Failure to hold the breakout could lead to consolidation toward $76,000 or $78,000, which now form the nearest support zone.
Momentum indicators support the short-term bullish structure. The Know Sure Thing indicator stood near 112.50, well above its signal line around 40.20. The reading shows that upward momentum has accelerated.
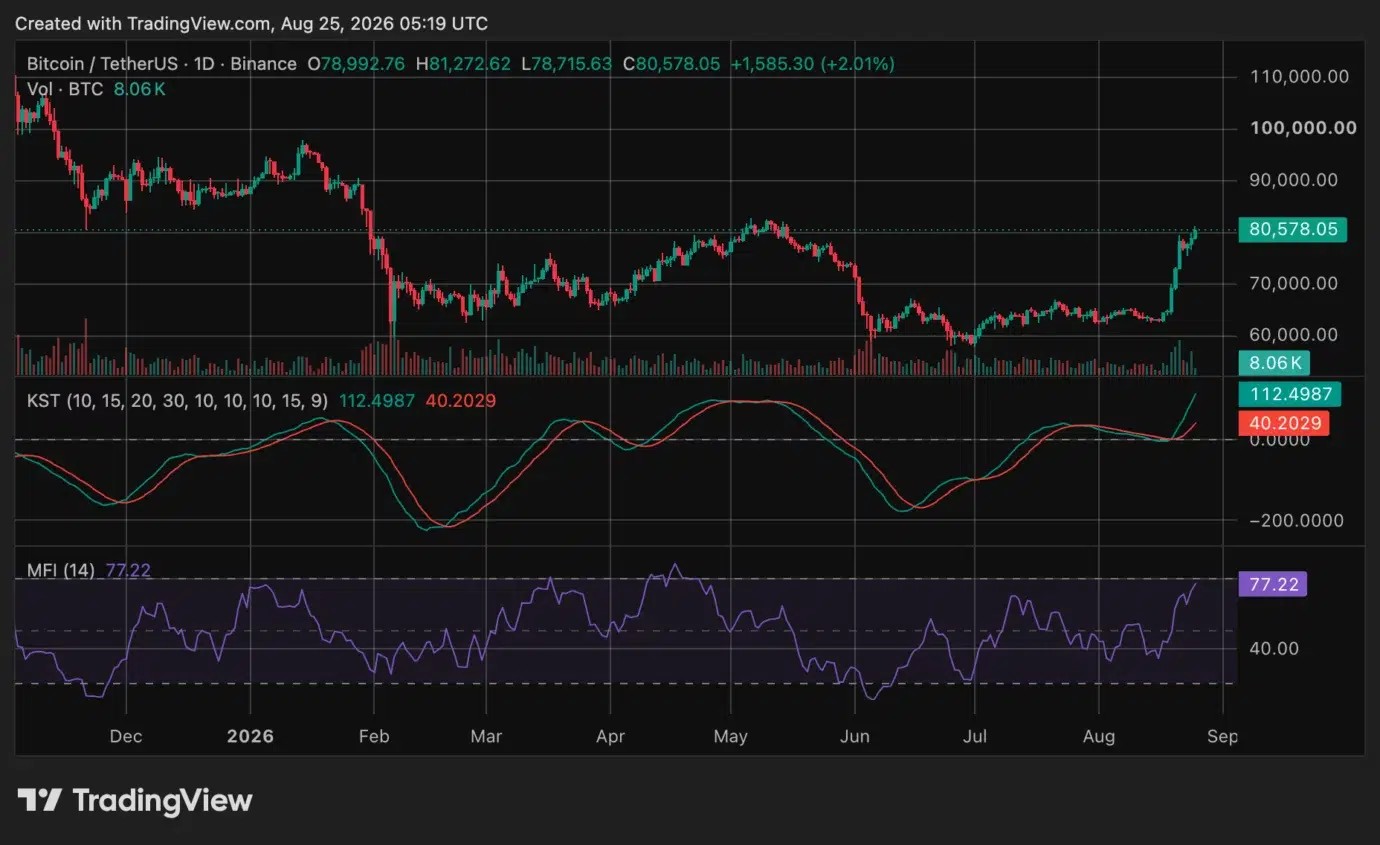
The Money Flow Index reached 77.22. That indicates strong capital inflows but also places the indicator near its conventional overbought level of 80. Elevated readings do not guarantee a reversal, though they show that the rally may be stretched.
Rekt Capital described the weekly close above $BTC’s 50-week exponential moving average as technically bullish. However, the analyst warned in an X post that the margin above the average remained narrow.
“A failed retest could turn the move into a fake breakout similar to Bitcoin’s earlier relief rally,” the analyst warned.
#$BTC
Bitcoin has actually performed a marginal Weekly Close above the 50-week EMA (purple)
Technically, this is a bullish Weekly Close
However, because it is a marginal one, price has very little room to dip to perform a successful retest
Market conditions will need to be… https://t.co/dOtDQ7ElWs pic.twitter.com/QoiMXTcTtx
— Rekt Capital (@rektcapital) August 24, 2026
ETF inflows provided identifiable Bitcoin demand
U.S.-listed spot Bitcoin exchange-traded funds recorded approximately $1.9 billion in net inflows during the week ending Aug. 21. The funds attracted capital for five consecutive sessions, marking their strongest weekly intake since October 2025.
The inflows offered evidence of spot demand alongside futures-market activity. BlackRock’s iShares Bitcoin Trust accounted for a large portion of the buying during the week.
As crypto.news reported in its coverage of Bitcoin’s approach toward $80,000, forced short liquidations also accelerated the initial move. Traders who had bet on lower prices were required to buy Bitcoin as the market rose.
That buying can produce rapid advances but may not provide lasting support. Continued ETF and direct spot-market demand will therefore remain important if $BTC is to hold above $80,000.
Treasury buybacks improved the liquidity narrative
The rally began shortly after the U.S. Treasury expanded its planned buybacks of longer-dated government securities.
On Aug. 19, the Treasury said it would increase the maximum size of certain liquidity-support operations from $2 billion to at least $4 billion. The larger operations will run from Sept. 9 through Nov. 4, according to the department’s official statement.
Buybacks allow the Treasury to purchase older, less liquid securities while issuing other debt. The change does not constitute Federal Reserve quantitative easing, and no government agency has established that it directly caused $BTC’s rally.
However, the announcement initially pushed longer-term yields lower and improved investor expectations about market liquidity. $BTC’s first breakout during the move took it above $71,000, as previously reported.
Reports have also discussed using part of the Treasury General Account to finance larger buybacks. The account is expected to hold roughly $950 billion at the end of September. Treasury has not announced a program committing that full amount to bond purchases.
Inflation data will test whether the rally can continue
The next major U.S. macroeconomic event arrives on Aug. 26. The Bureau of Economic Analysis will publish July personal income, spending and PCE inflation figures at 8:30 a.m. Eastern time, according to its official schedule.
The PCE price index is the Federal Reserve’s preferred inflation measure. A stronger-than-expected reading could lift Treasury yields and reduce demand for risk assets. Softer data could support expectations for easier financial conditions.
The crypto must also hold its 50-week exponential moving average during any pullback. A successful retest would strengthen the breakout case. A weekly close below that level would raise the probability that the move represented another temporary relief rally.
The confirmed evidence currently shows a rapid price recovery, renewed ETF inflows and stronger momentum. Whether those conditions can sustain $BTC above $80,000 remains unconfirmed.