- Bitcoin ($BTC) is currently trading at the $77.5K mark.
- The short-term momentum is weaker than the long-term.
The largest and dominant asset, Bitcoin ($BTC), is trading at $77,578 with a 24-hour range of $76,297 to $77,830 and a seven-day range stretching from $76,297 to $81,281. Also, its volume sits at $26.79 billion. The bounce from $76K is significant.
$79,500 is the resistance $BTC has failed to properly reclaim multiple times since breaking above $80K. Every attempt has been met with sellers defending that level. Until it breaks $79.5K and holds it on the 4-hour chart, the recovery stays unconfirmed.
A head and shoulders pattern has formed on the recent timeframe. Price has already lost the neckline and is now attempting a retest. A rejection at the neckline opens the door toward $71K. The setup gets invalidated only if Bitcoin reclaims the neckline and holds above it.
The $BTC Price Levels That Decide Everything Ahead
The $79,500 zone is the resistance that needs to be broken. A clean 4-hour close above it makes $80K easier to take out, with $81K–$82K as the next targets above that. The descending trendline near $80K has been tested multiple times and continues to act as a strong barrier.
Moreover, $76K is the support that needs to hold. Lose it, and the chart starts looking considerably less comfortable. Below $76K, the watch zone drops to $72K–$70K, where the next crucial support sits.
For the short-term correction, the $75,800 level represents a buying opportunity with DCA in the $75,000 range. A drop to $73K signals a sharper decline in the cycle, with long-term expectations pointing to $68,000 in that case. The bigger structure remains intact as long as Bitcoin holds above the $70,500 pivot.
The biggest selling zone in the current setup sits at $83,000–$85,000, a more realistic threshold than the $92,000 and $105,000 targets that were circulating earlier. $BTC is still in a short-term correction from the $78K–$76K area, and the current price around $77K is roughly the halfway point of that correction.
Where is Bitcoin’s Momentum Heading in the Near Term?
The technical chart analysis shows that the Moving Average Convergence Divergence (MACD) line is positioned below the signal line. As both lines are below the zero line, it hints at strong bearish momentum. The short-term momentum is weaker than the long-term, putting it in a broader downside.
This bearish crossover of Bitcoin shows that the selling pressure is actively accelerating downward. This is one of the strongest sell or trend-continuation signals on the chart, showing that bears are in firm control of the market.
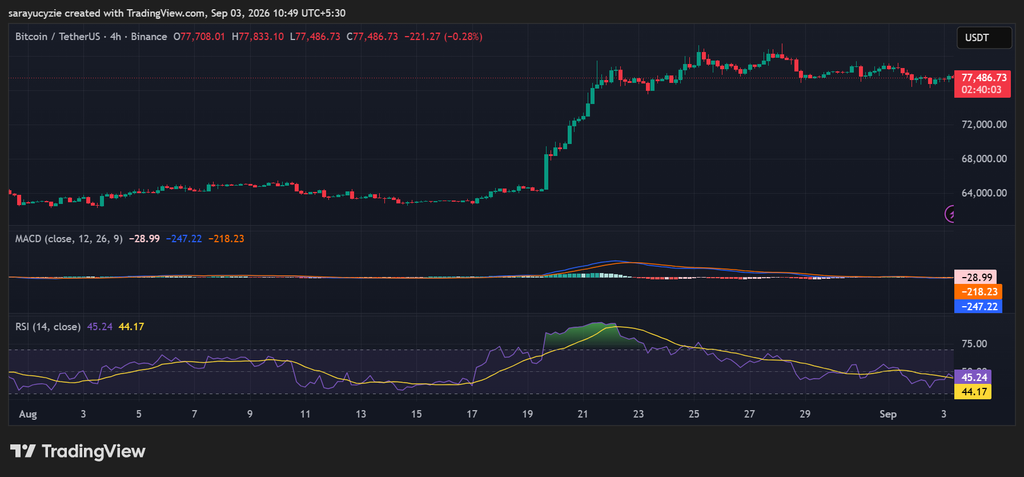
Furthermore, the daily Relative Strength Index (RSI) at 45.24 reflects a neutral-to-slightly negative trend. The reading is sitting below the 50 midpoint, indicating that the recent price declines slightly outweigh recent price gains. Sellers have a slight edge, but there is no strong downward trend.
There is plenty of room for the price action to move in either direction before hitting extreme territory. This reflects the $BTC market in consolidation, and traders wait for a break above 50 or below 40 to confirm the next move.