
Saturday has started with the correction of some coins, according to CoinStats.
BTC/USD
The rate of Bitcoin (BTC) has fallen by 0.4% since yesterday.
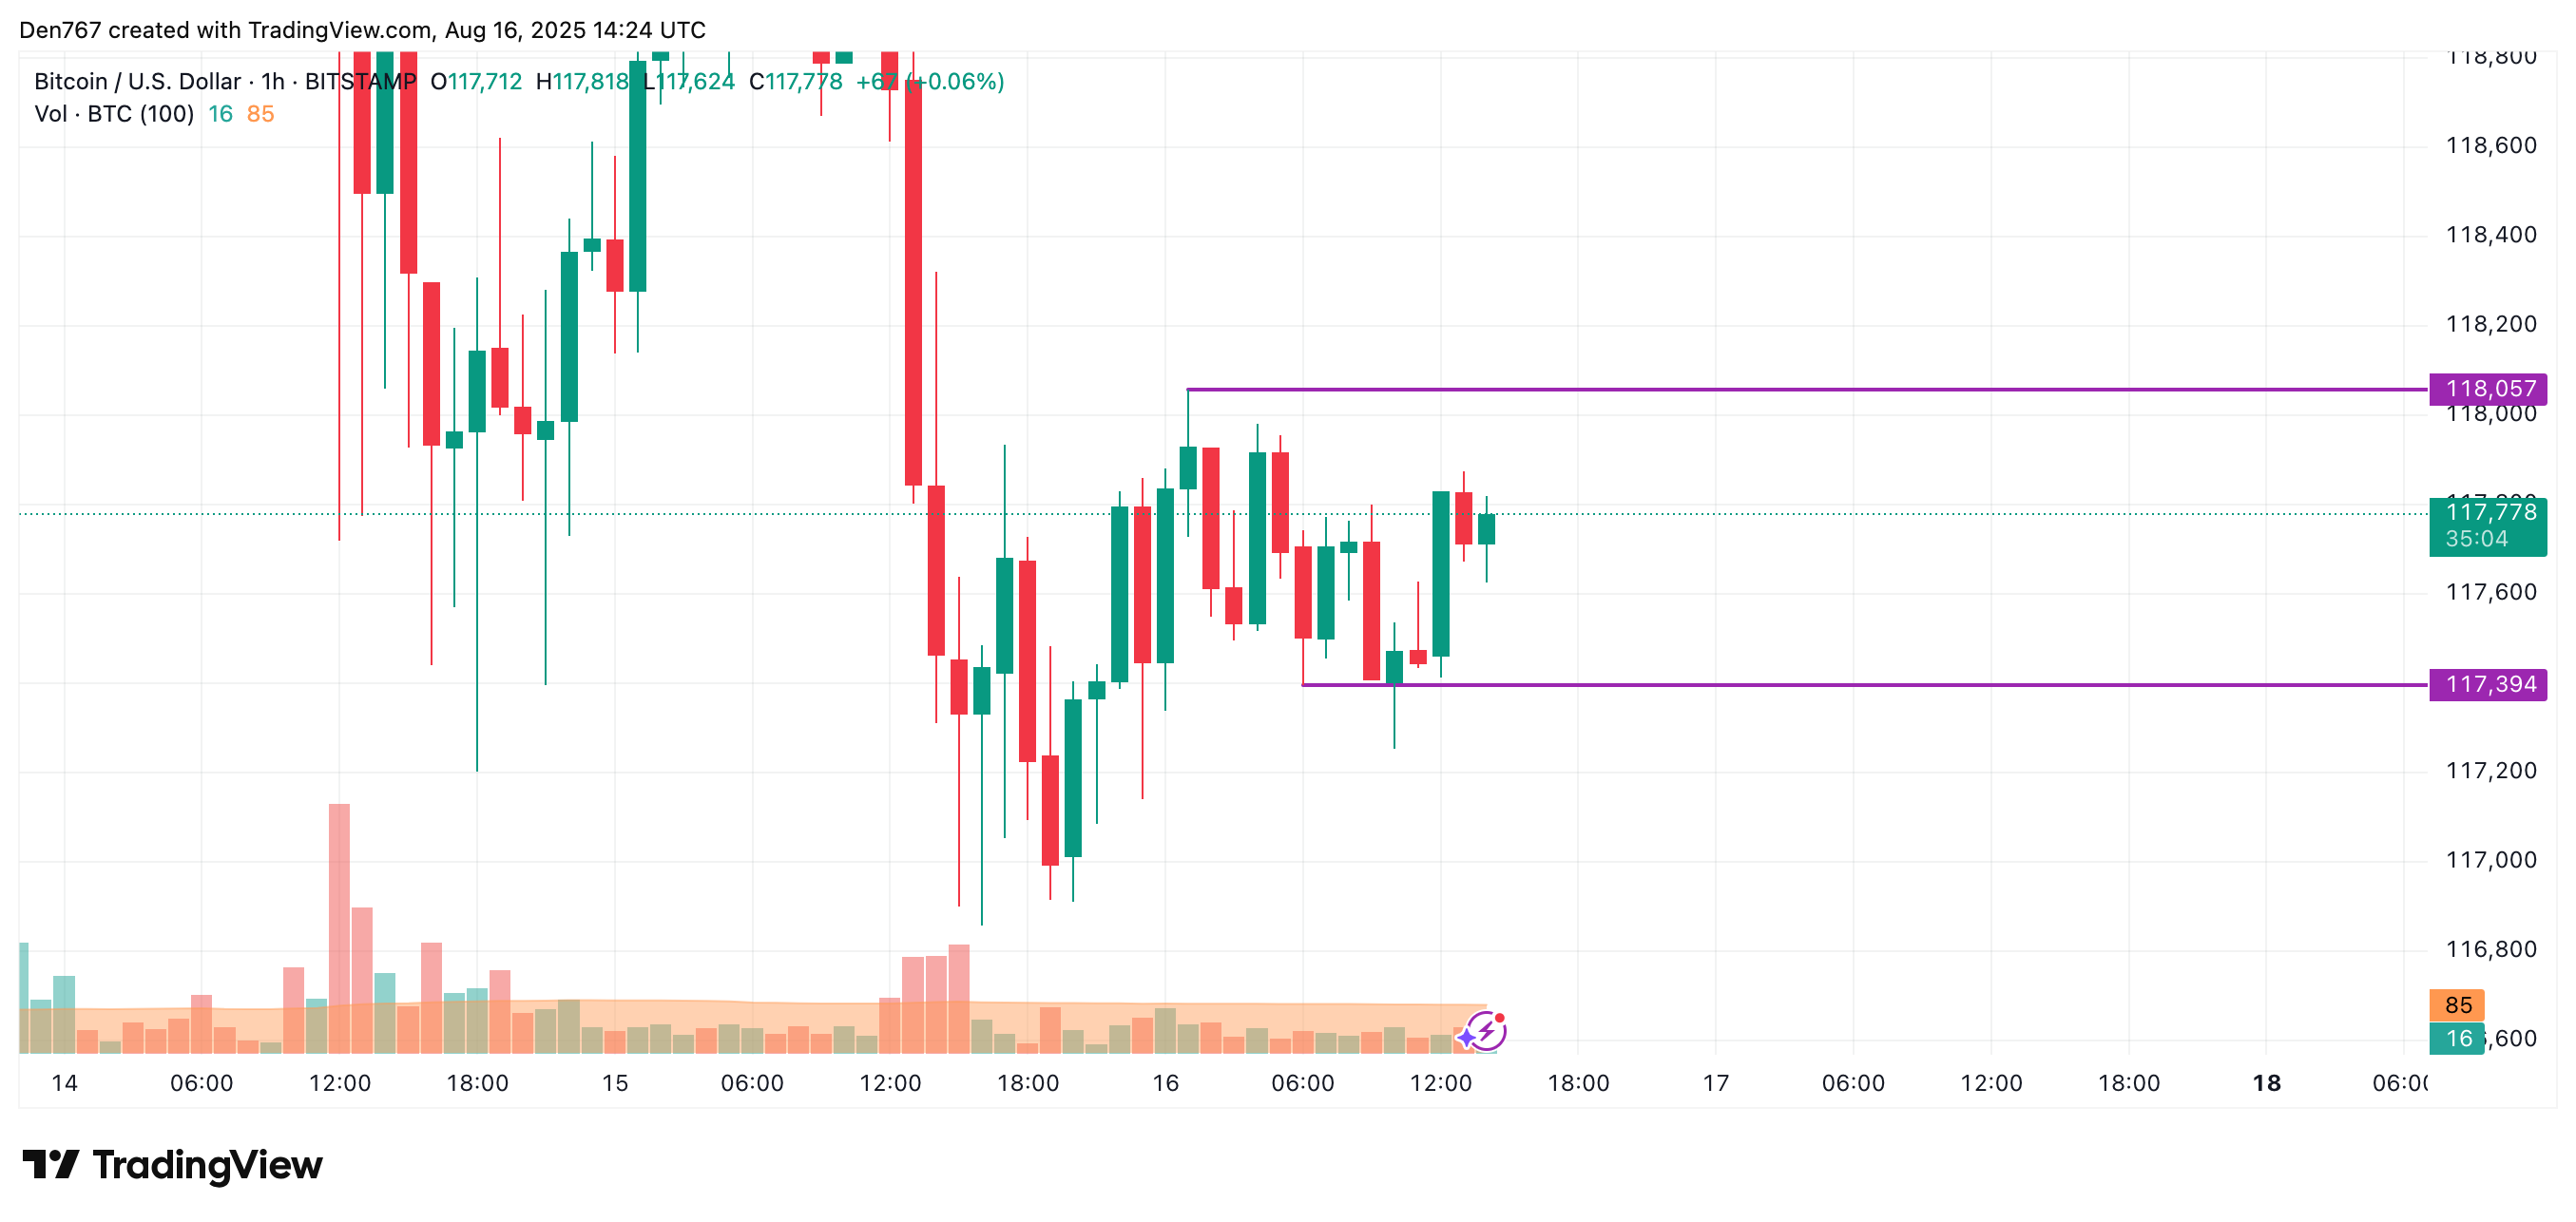
On the hourly chart, the price of BTC is rising after a false breakout of the local support of $117,394. If the growth continues, one can expect a test of the resistance by tomorrow.
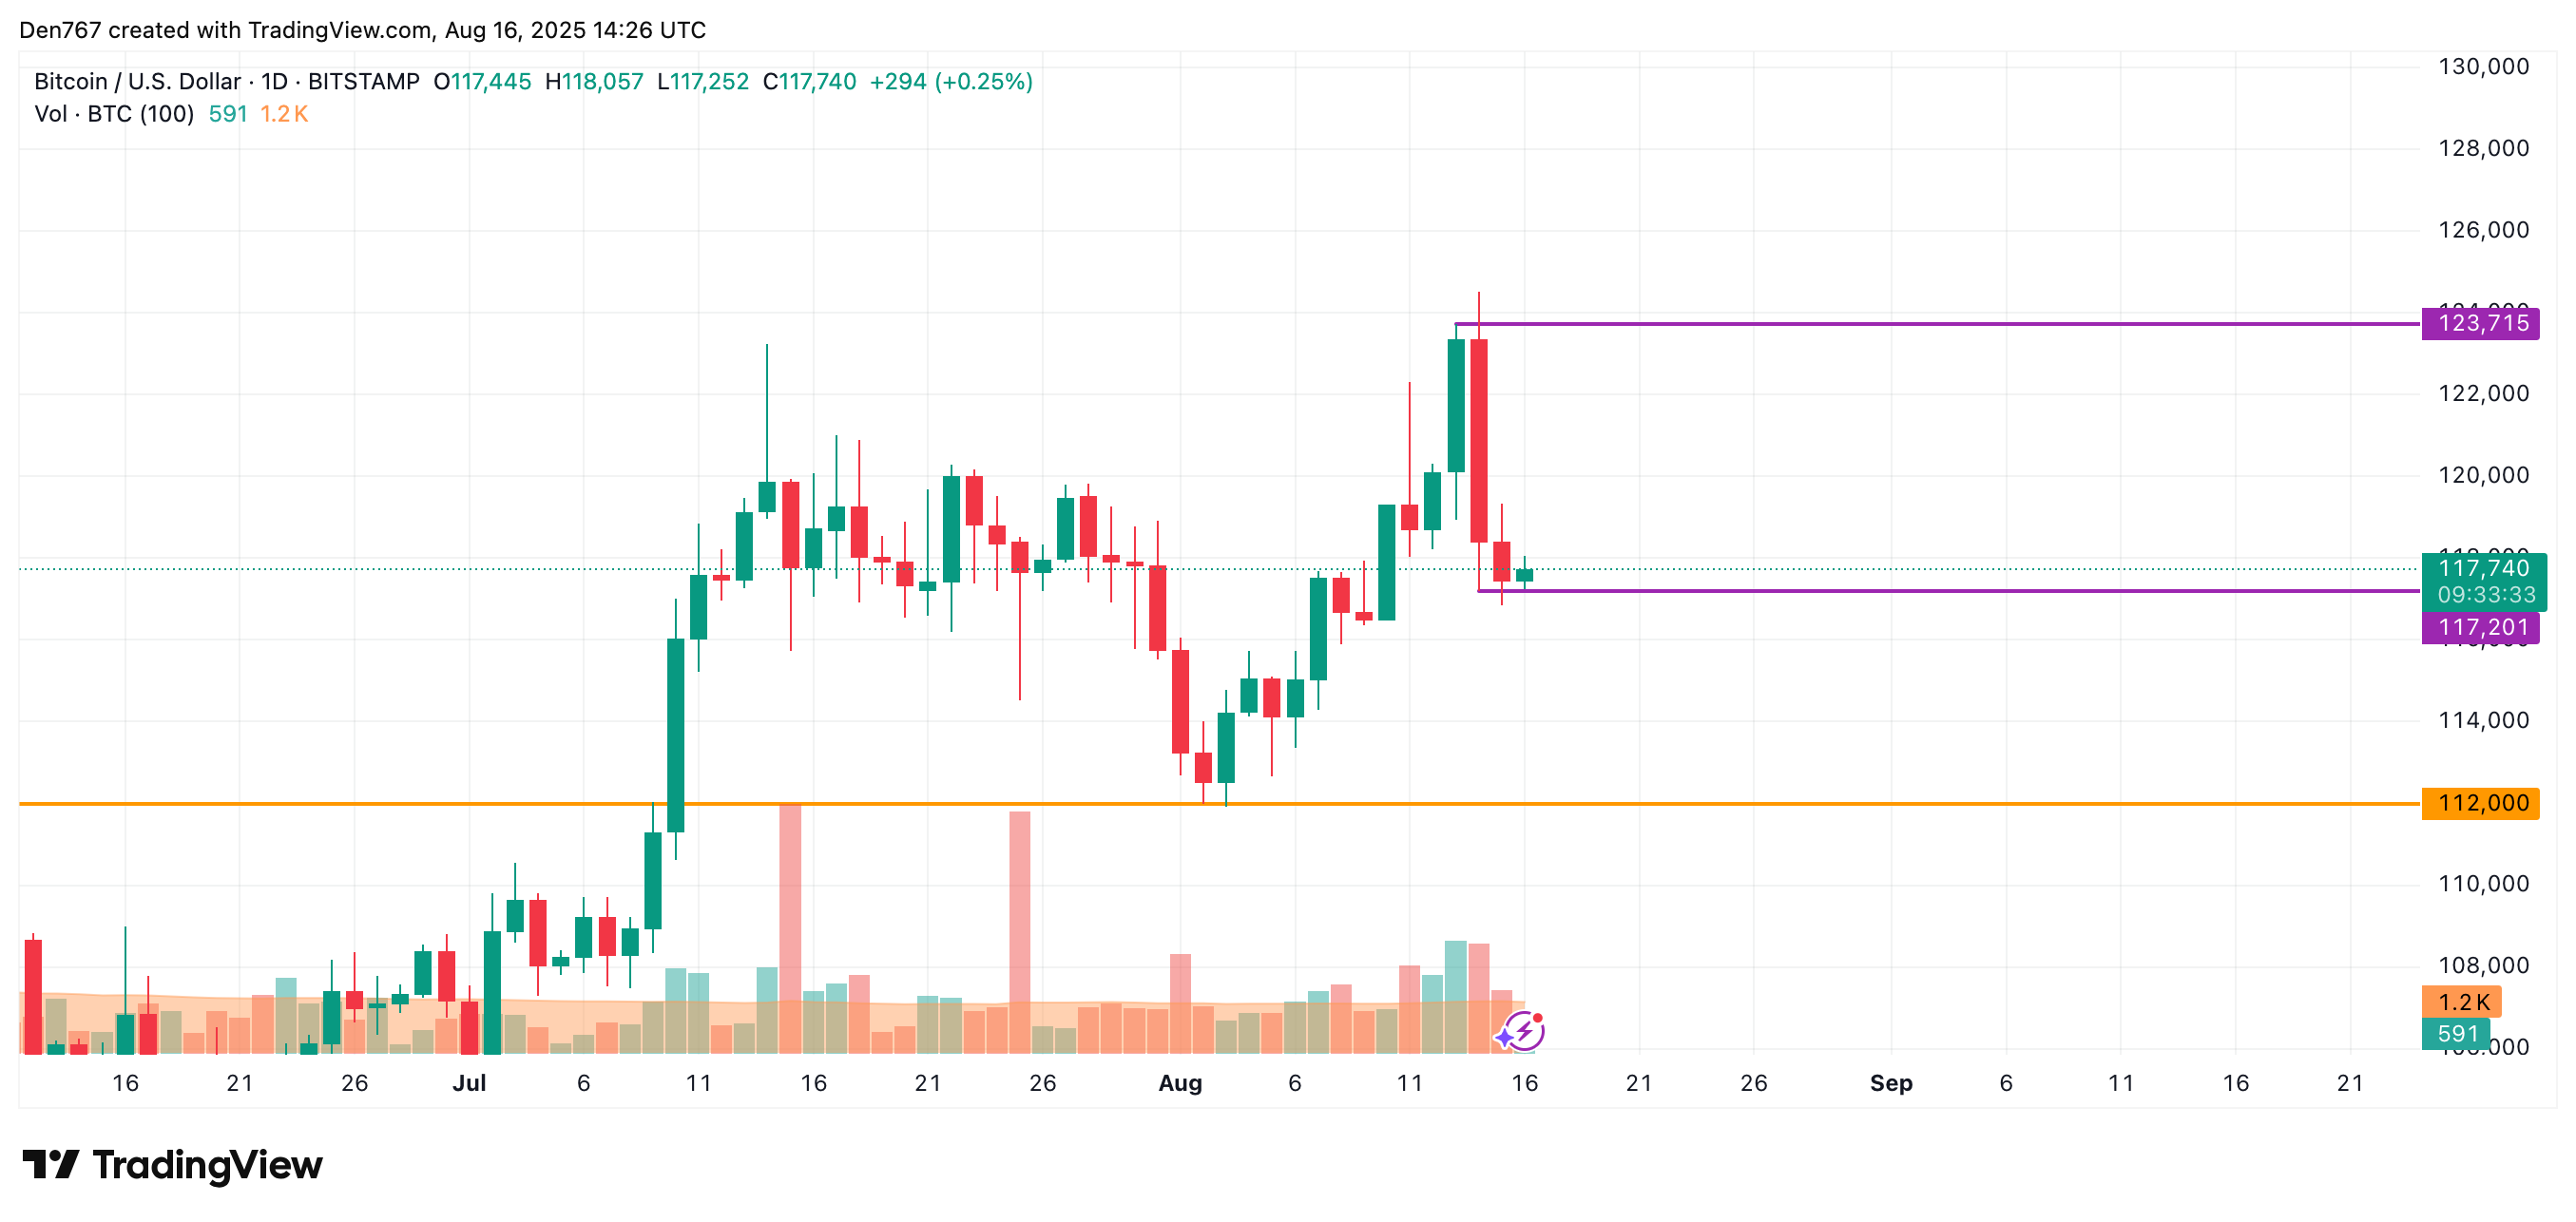
On the bigger time frame, the picture is less bullish. The rate of the main crypto is closer to the support level, which is a bearish signal.
If a breakout of the $117,201 mark happens, the accumulated energy might be enough for a drop to the $115,000-$116,000 range.
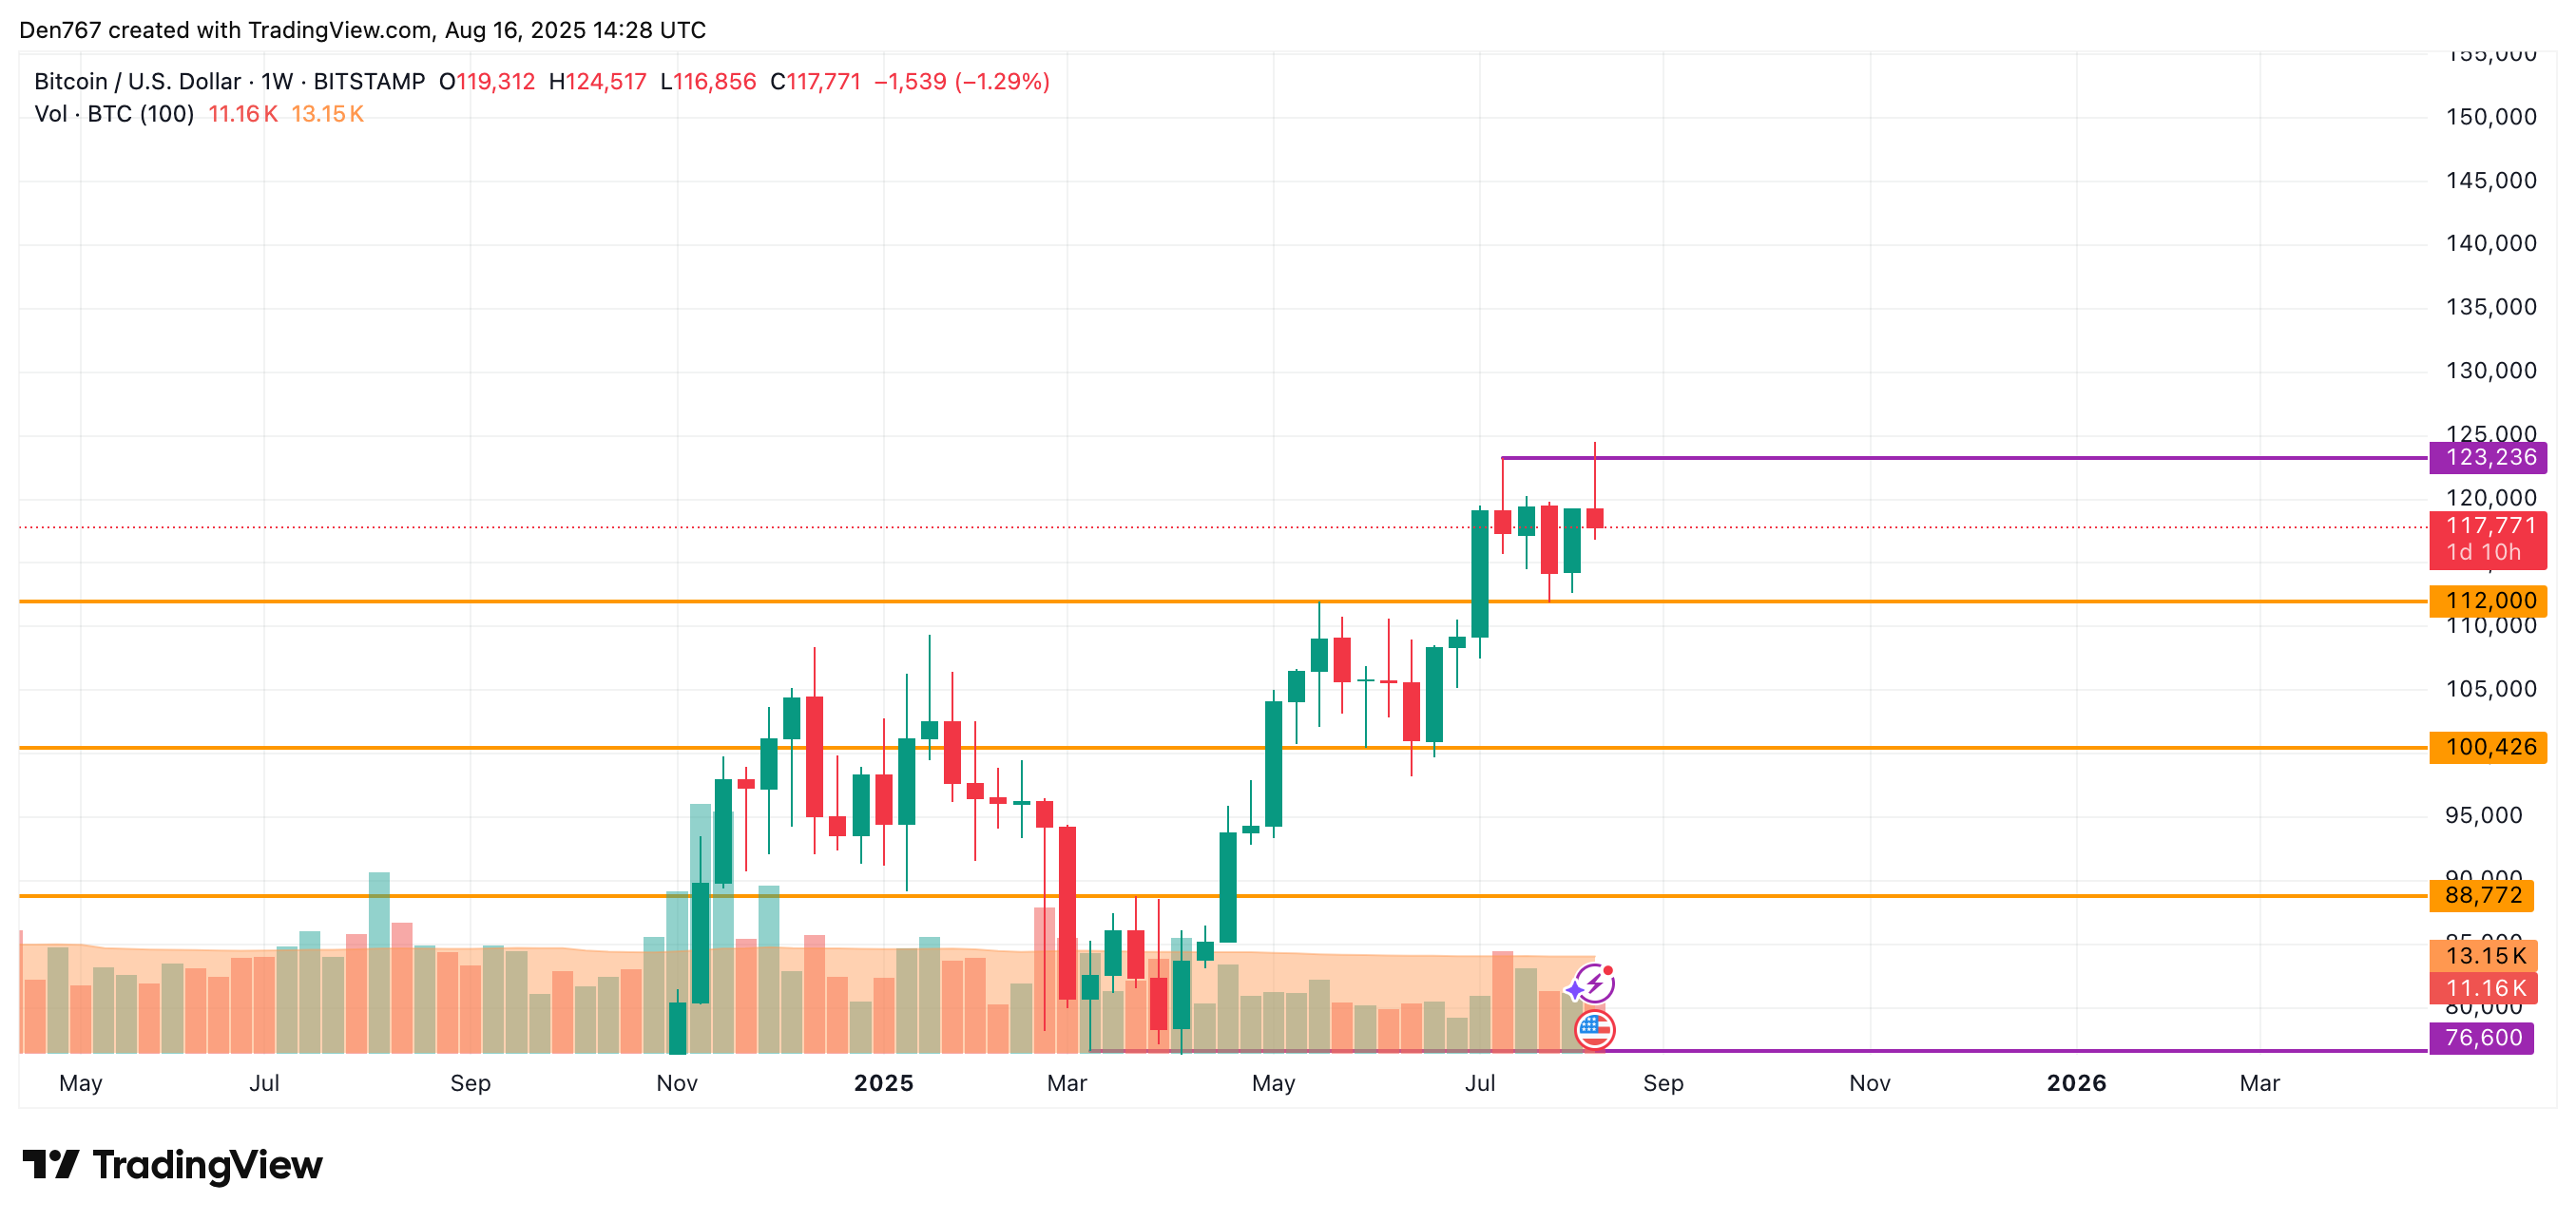
From the midterm point of view, the price of BTC has made a false breakout of the $123,236 level. If the weekly bar closes far from that mark, bears may seize the initiative, which may lead to an ongoing correction to the $112,000 area.
Bitcoin is trading at $117,837 at press time.