Bitcoin has experienced a significant surge since the beginning of August, rising from about $63,000 to a recent high of about $87,000, before slightly declining to trade at about $84,600. Bitcoin has risen significantly above both its short-term and long-term moving averages, due to the steady and mostly uninterrupted movement.
Market is stabilzing
In a comparable period, the U.S. dollar index has also improved, rising from lows around 98.40 in early September to above 101.00 at the moment. This is a reversal after the index had spent the majority of the summer falling from July’s highs around 101.6.
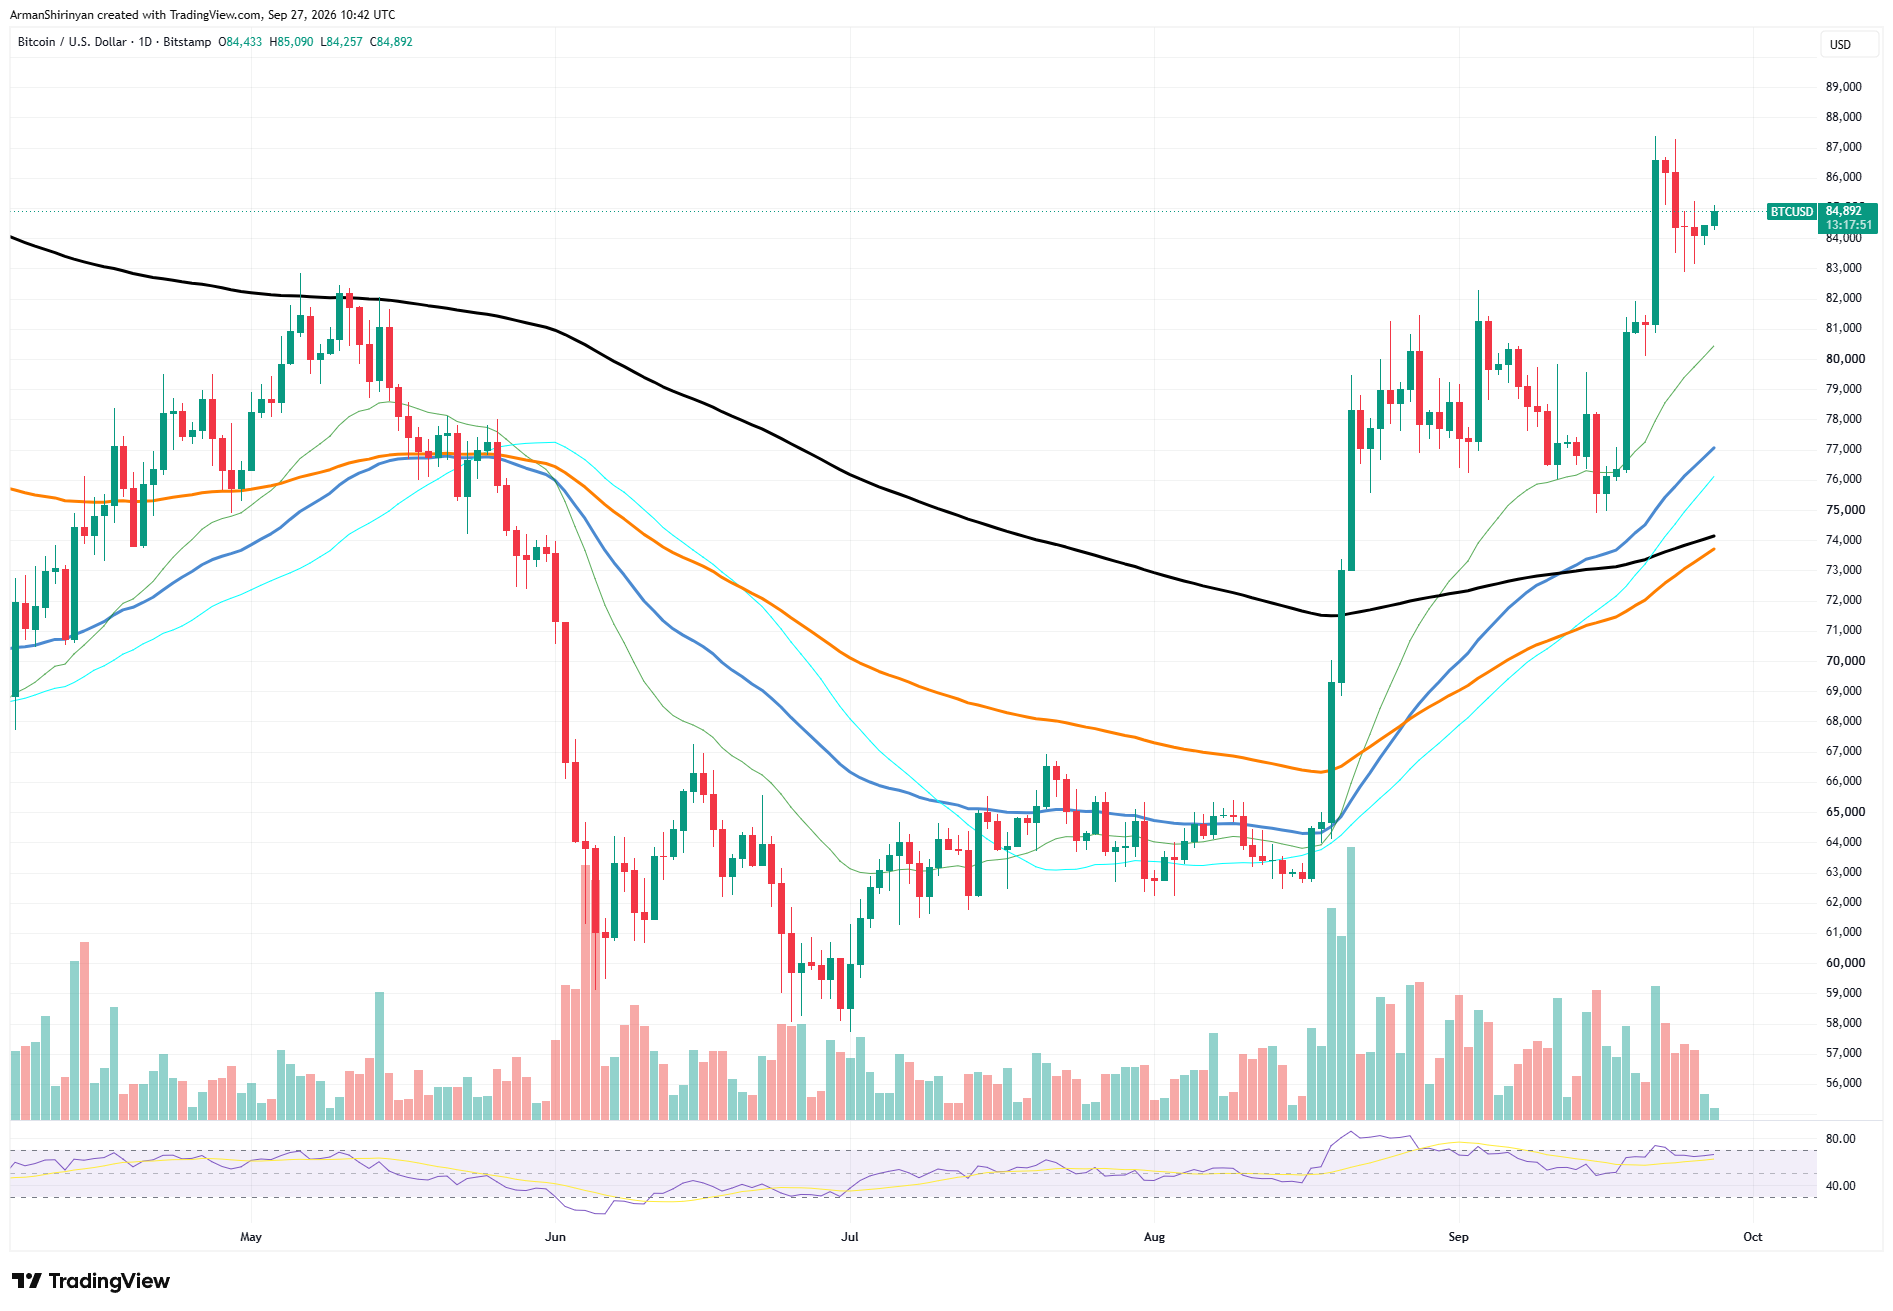
Over the last few sessions, the dollar has been growing, which has coincided with Bitcoin’s ongoing surge to its own local highs. This concurrent strength is noteworthy, because Bitcoin and gold have frequently been positioned as a hedge against dollar weakness, especially during times of expectations for monetary easing or worries about fiscal policy.
Market’s risky positioning
The dollar’s conventional impact on cryptocurrency pricing may be outweighed by other factors, such as risk-on positioning, institutional allocation flows, or catalysts unique to Bitcoin, when both assets rise simultaneously. Nevertheless, a single overlapping rally does not always indicate a structural break in correlation.
Throughout multi-year cycles, the $BTC-DXY relationship has historically fluctuated between weakening and reasserting itself. There have also been brief periods of positive correlation in the past, but these have not stopped the larger inverse pattern.
If this alignment holds over the next few weeks, especially if the dollar keeps rising while Bitcoin either holds its gains or corrects, that would be a more telling sign. As of right now, the concurrent strength in both DXY and $BTC appears to be more of a transient decoupling than a long-term regime shift.
In order to ascertain whether Bitcoin’s rally can continue independent of dollar dynamics, or whether the historical inverse relationship eventually reasserts itself as it has in previous cycles, traders observing this dynamic will probably concentrate on upcoming macro catalysts, such as Federal Reserve commentary, inflation data, and changes in risk sentiment.