
Bitcoin fluctuated between $110,936 and $111,110 over the last hour, reflecting a tightening trading range. With a market capitalization of $2.20 trillion and 24-hour trading volume of $39.70 billion, bitcoin’s price maneuvered within a broader intraday range of $108,644 to $111,742, suggesting a consolidative tone after a recent rally.
Bitcoin
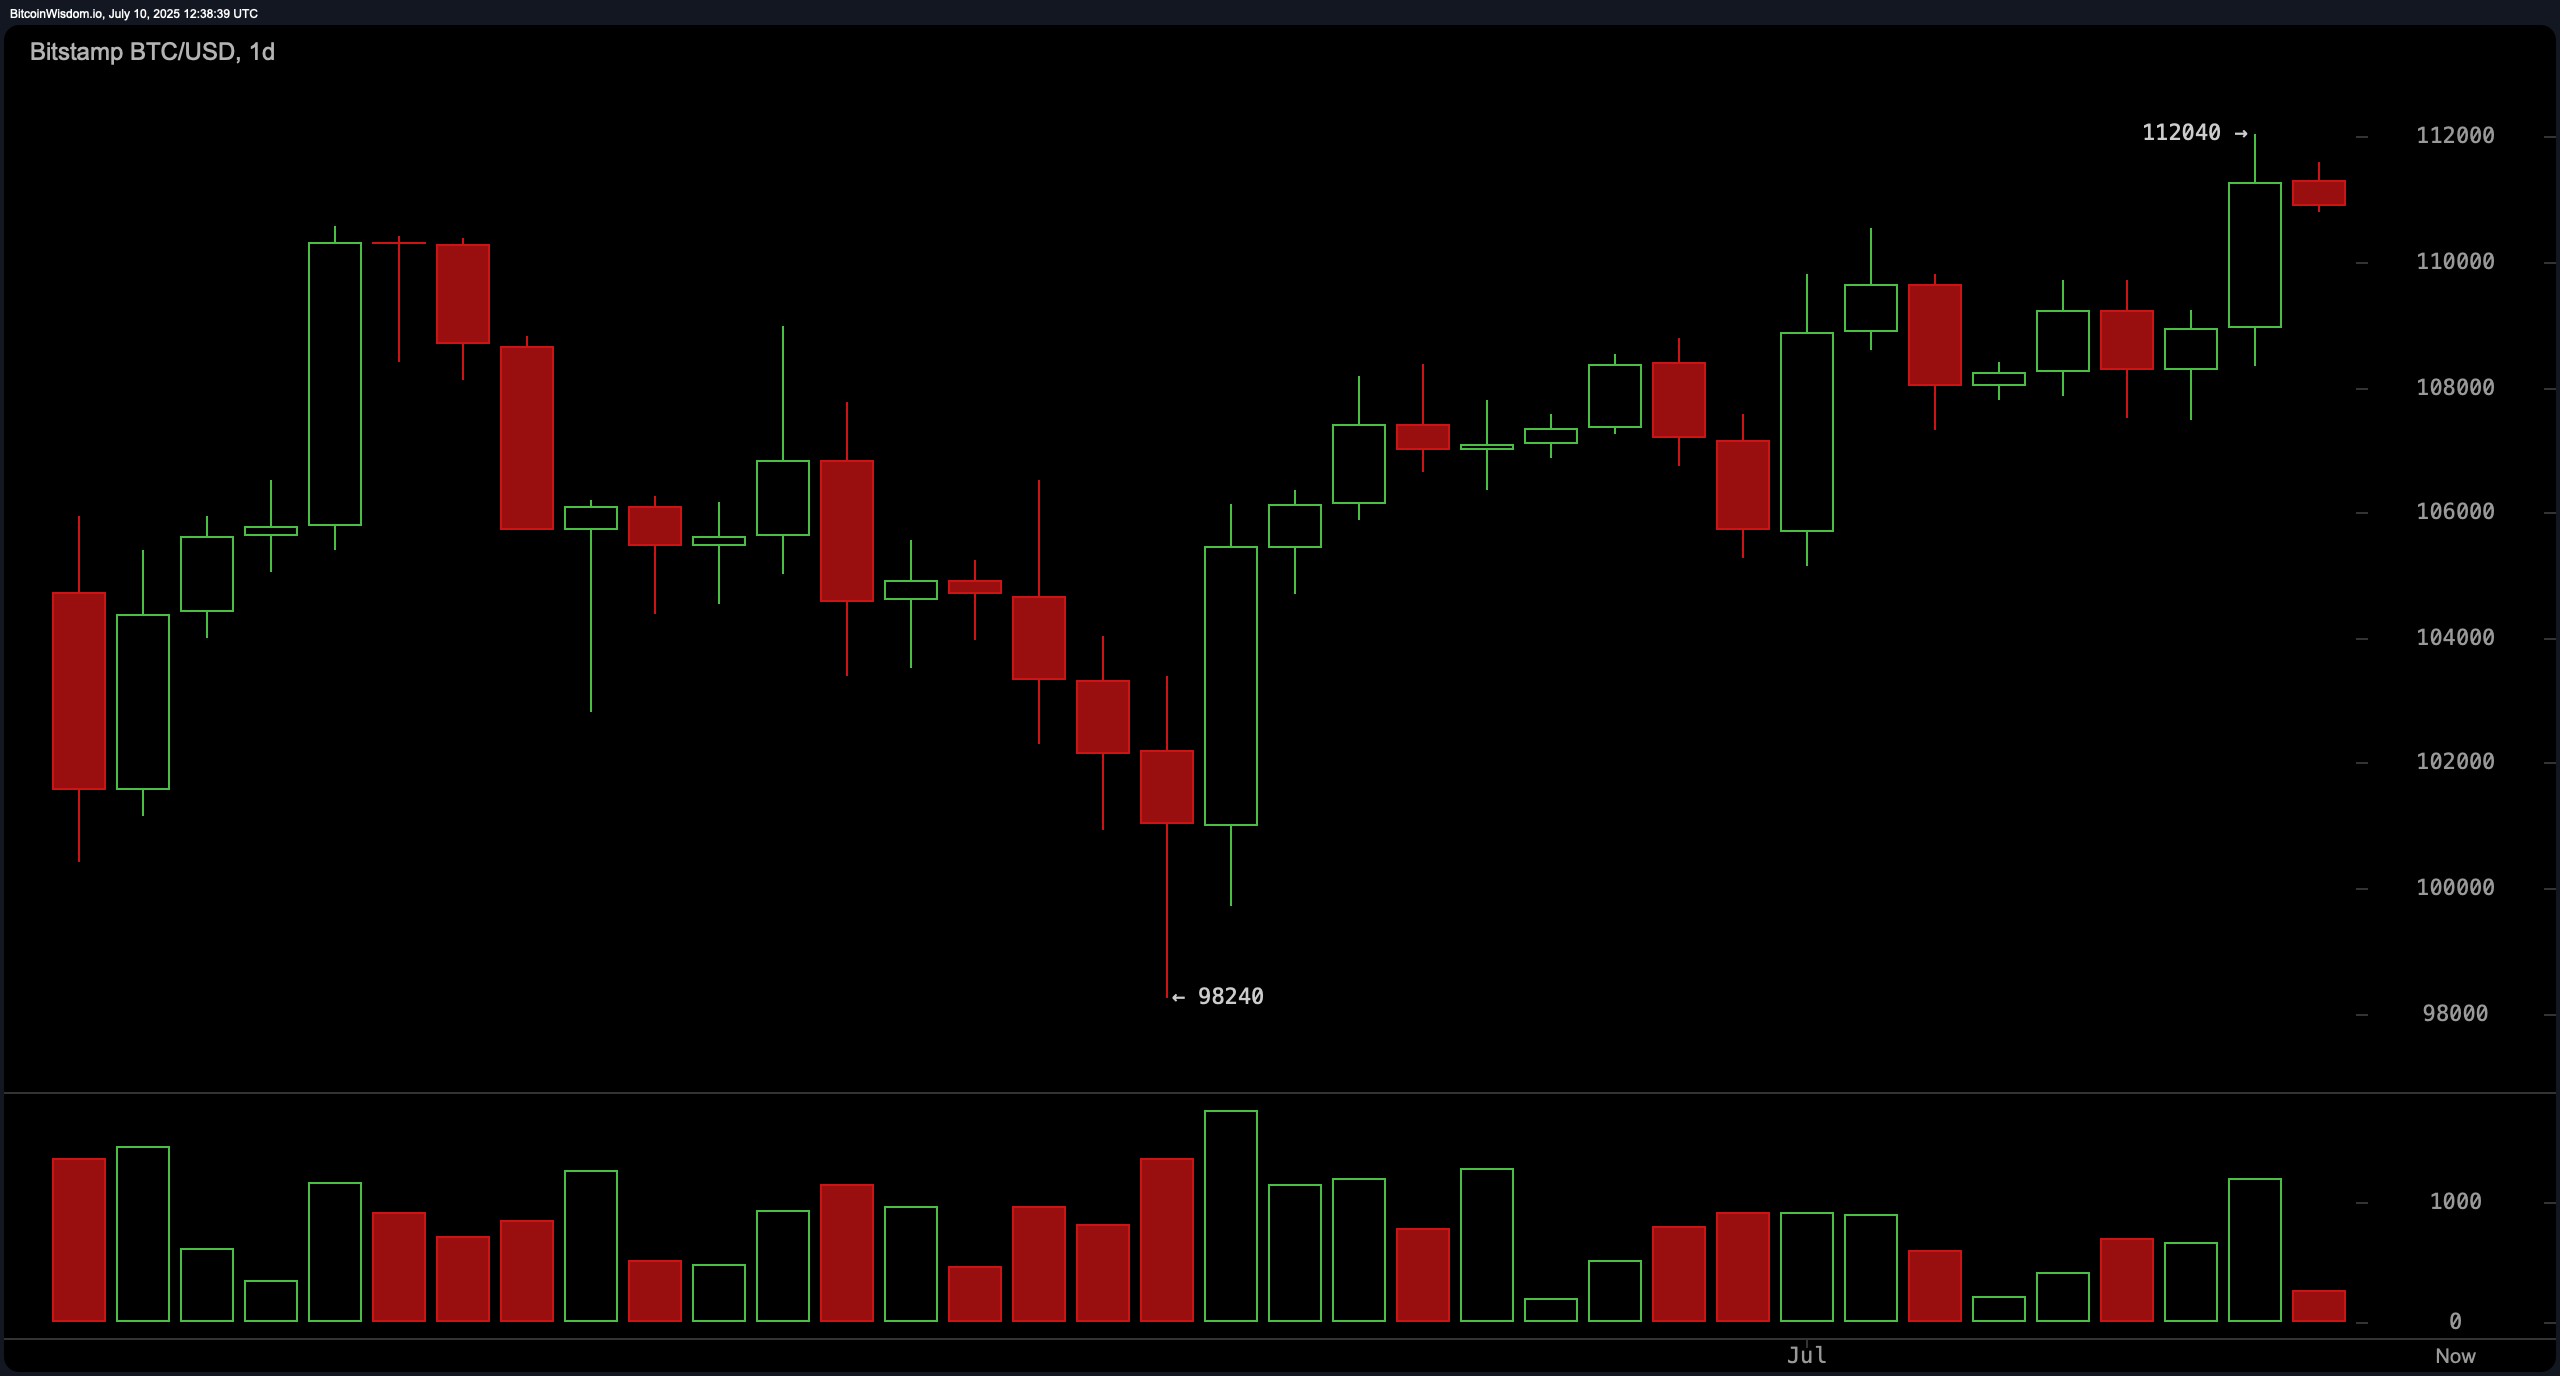
On the daily chart, bitcoin‘s trajectory shows a continuation of a short-term uptrend initiated from the $98,240 support level. Price action recently peaked at a local high of $112,040, supported by a bullish engulfing pattern and heightened volume, suggesting the breakout was fundamentally strong. However, subsequent candle formations exhibit indecision, with smaller bodies indicating waning momentum. This pattern implies a potential reversal zone around the $112,000 level, warranting caution from traders awaiting confirmation. Daily chart indicators still lean bullish, but the momentum’s deceleration introduces uncertainty in the immediate outlook.
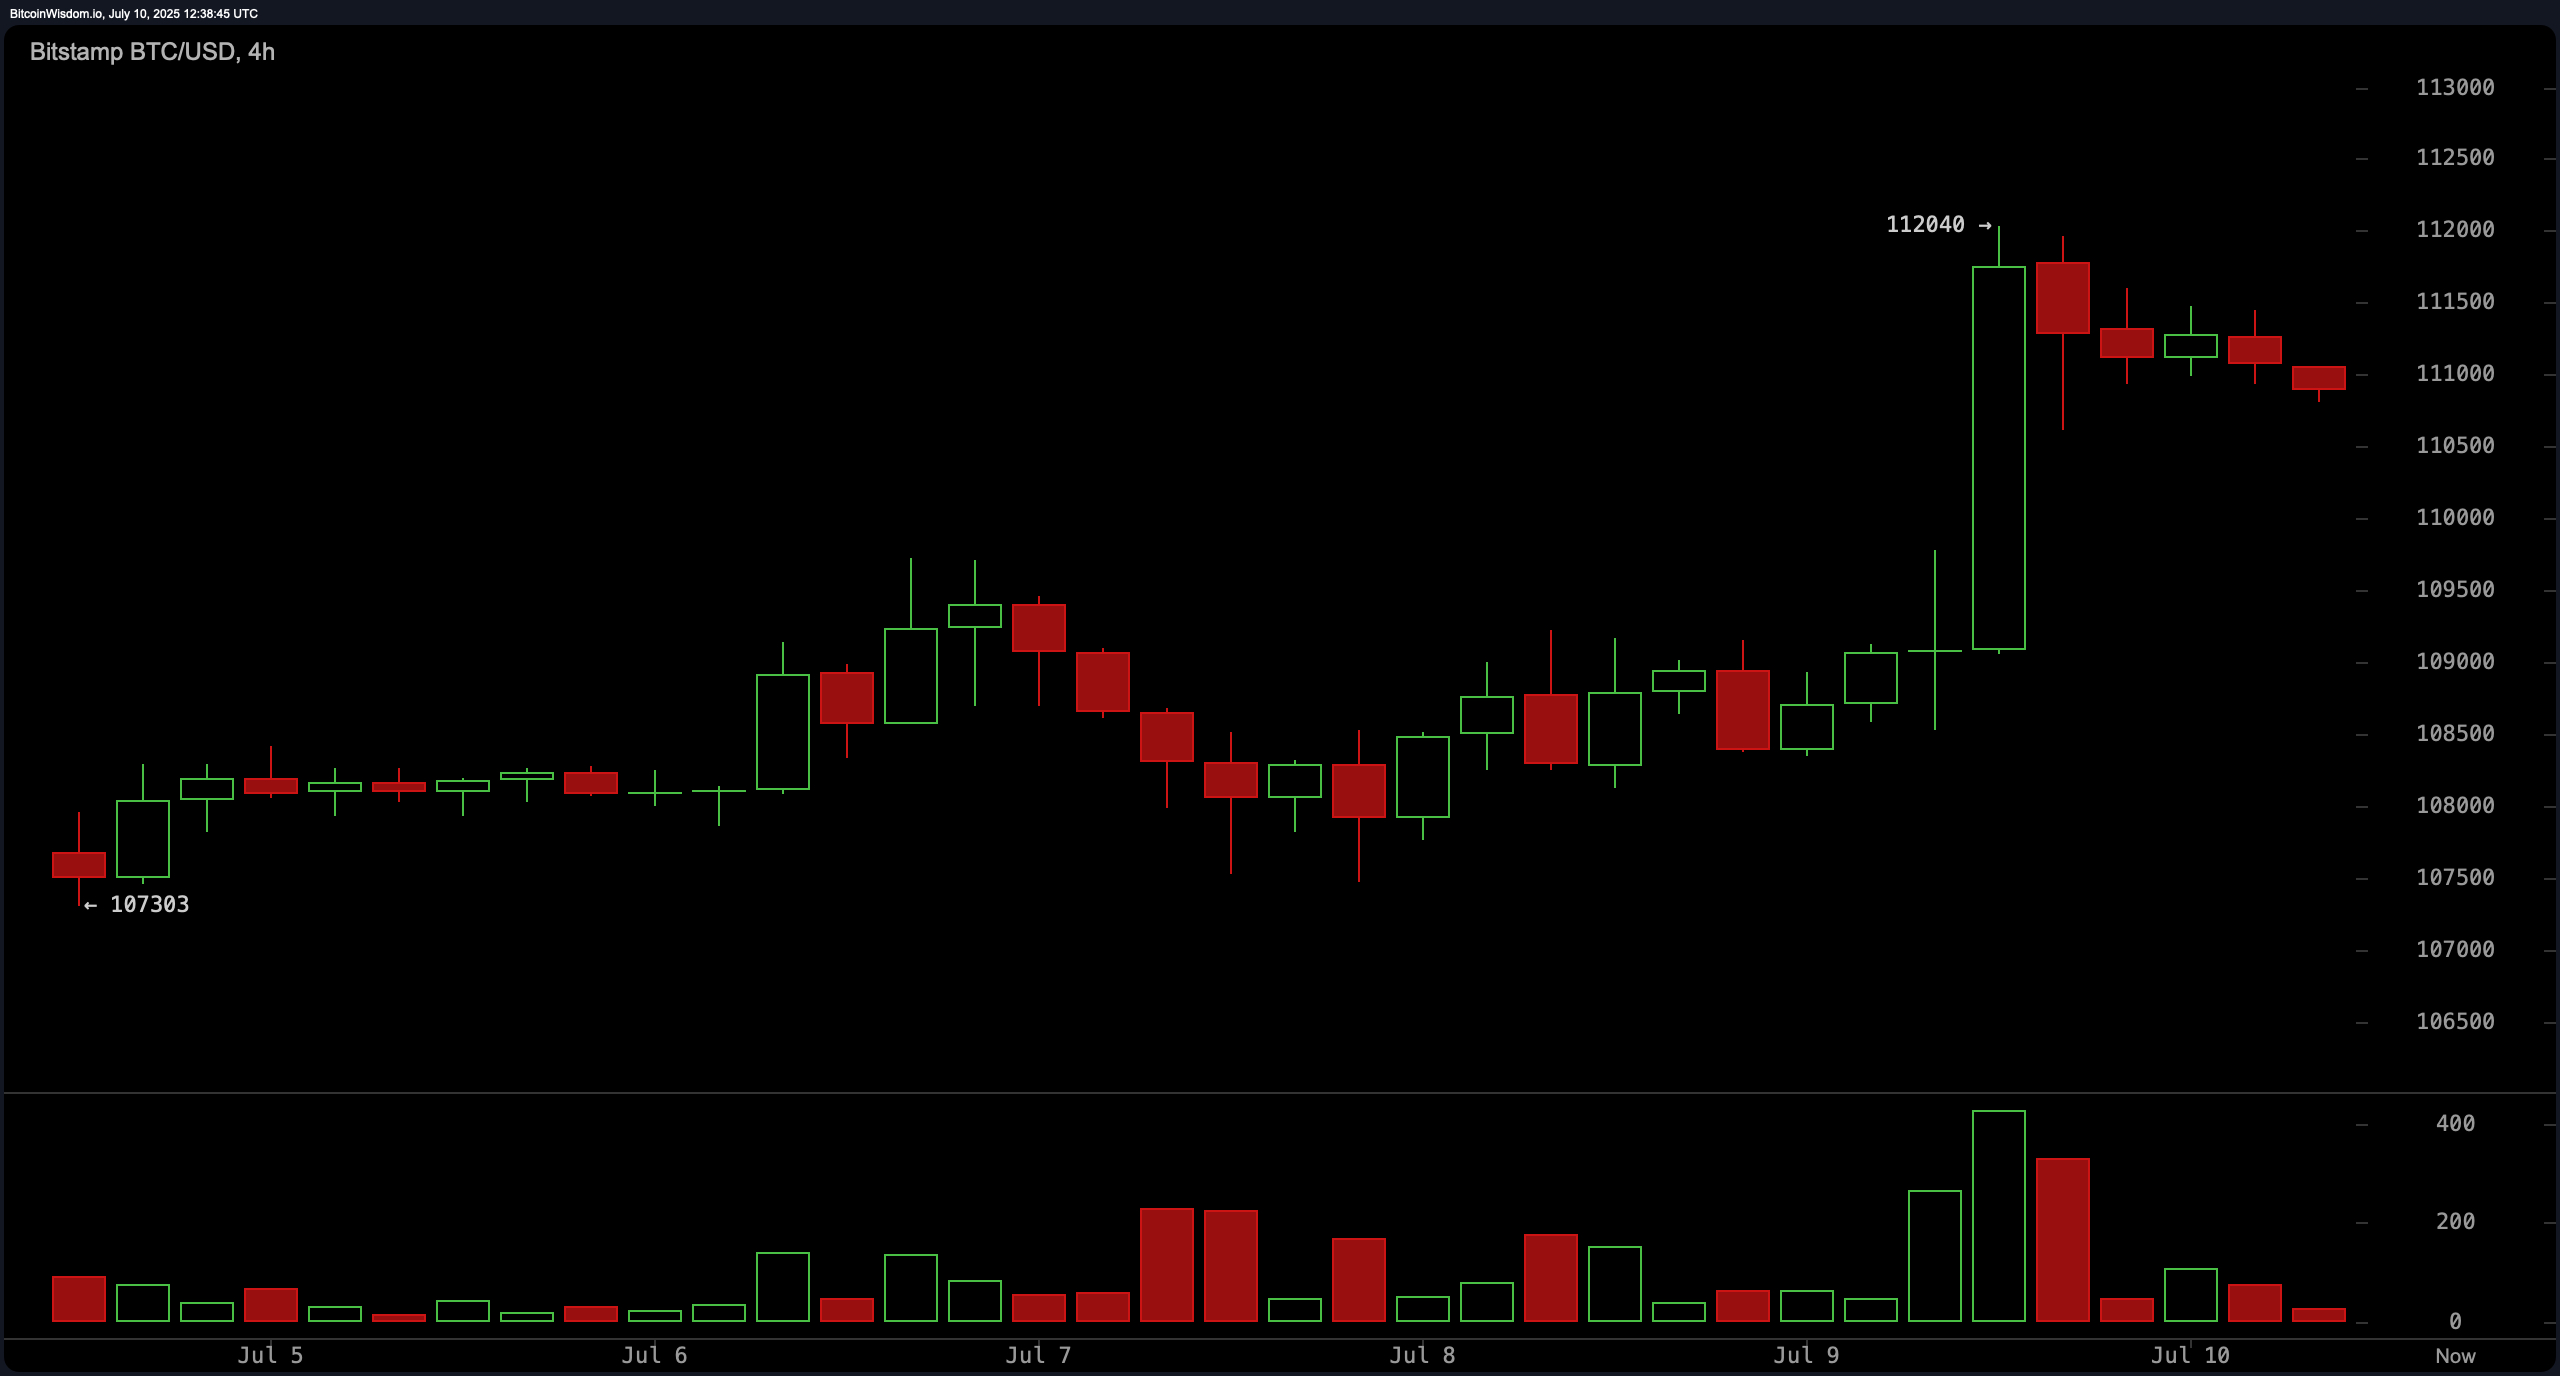
The 4-hour BTC/USD chart provides further evidence of near-term exhaustion. Bitcoin surged from approximately $109,000 to $112,040 on a high-volume breakout, signaling strong short-term bullish sentiment. Yet, the rally was quickly followed by a series of lower-volume red candles, often interpreted as a blow-off top or the onset of a consolidation phase. Price currently oscillates between $110,500 and $111,500, with a break below the lower boundary possibly indicating retracement. Conversely, a return to $112,000 with renewed volume could reignite bullish momentum.
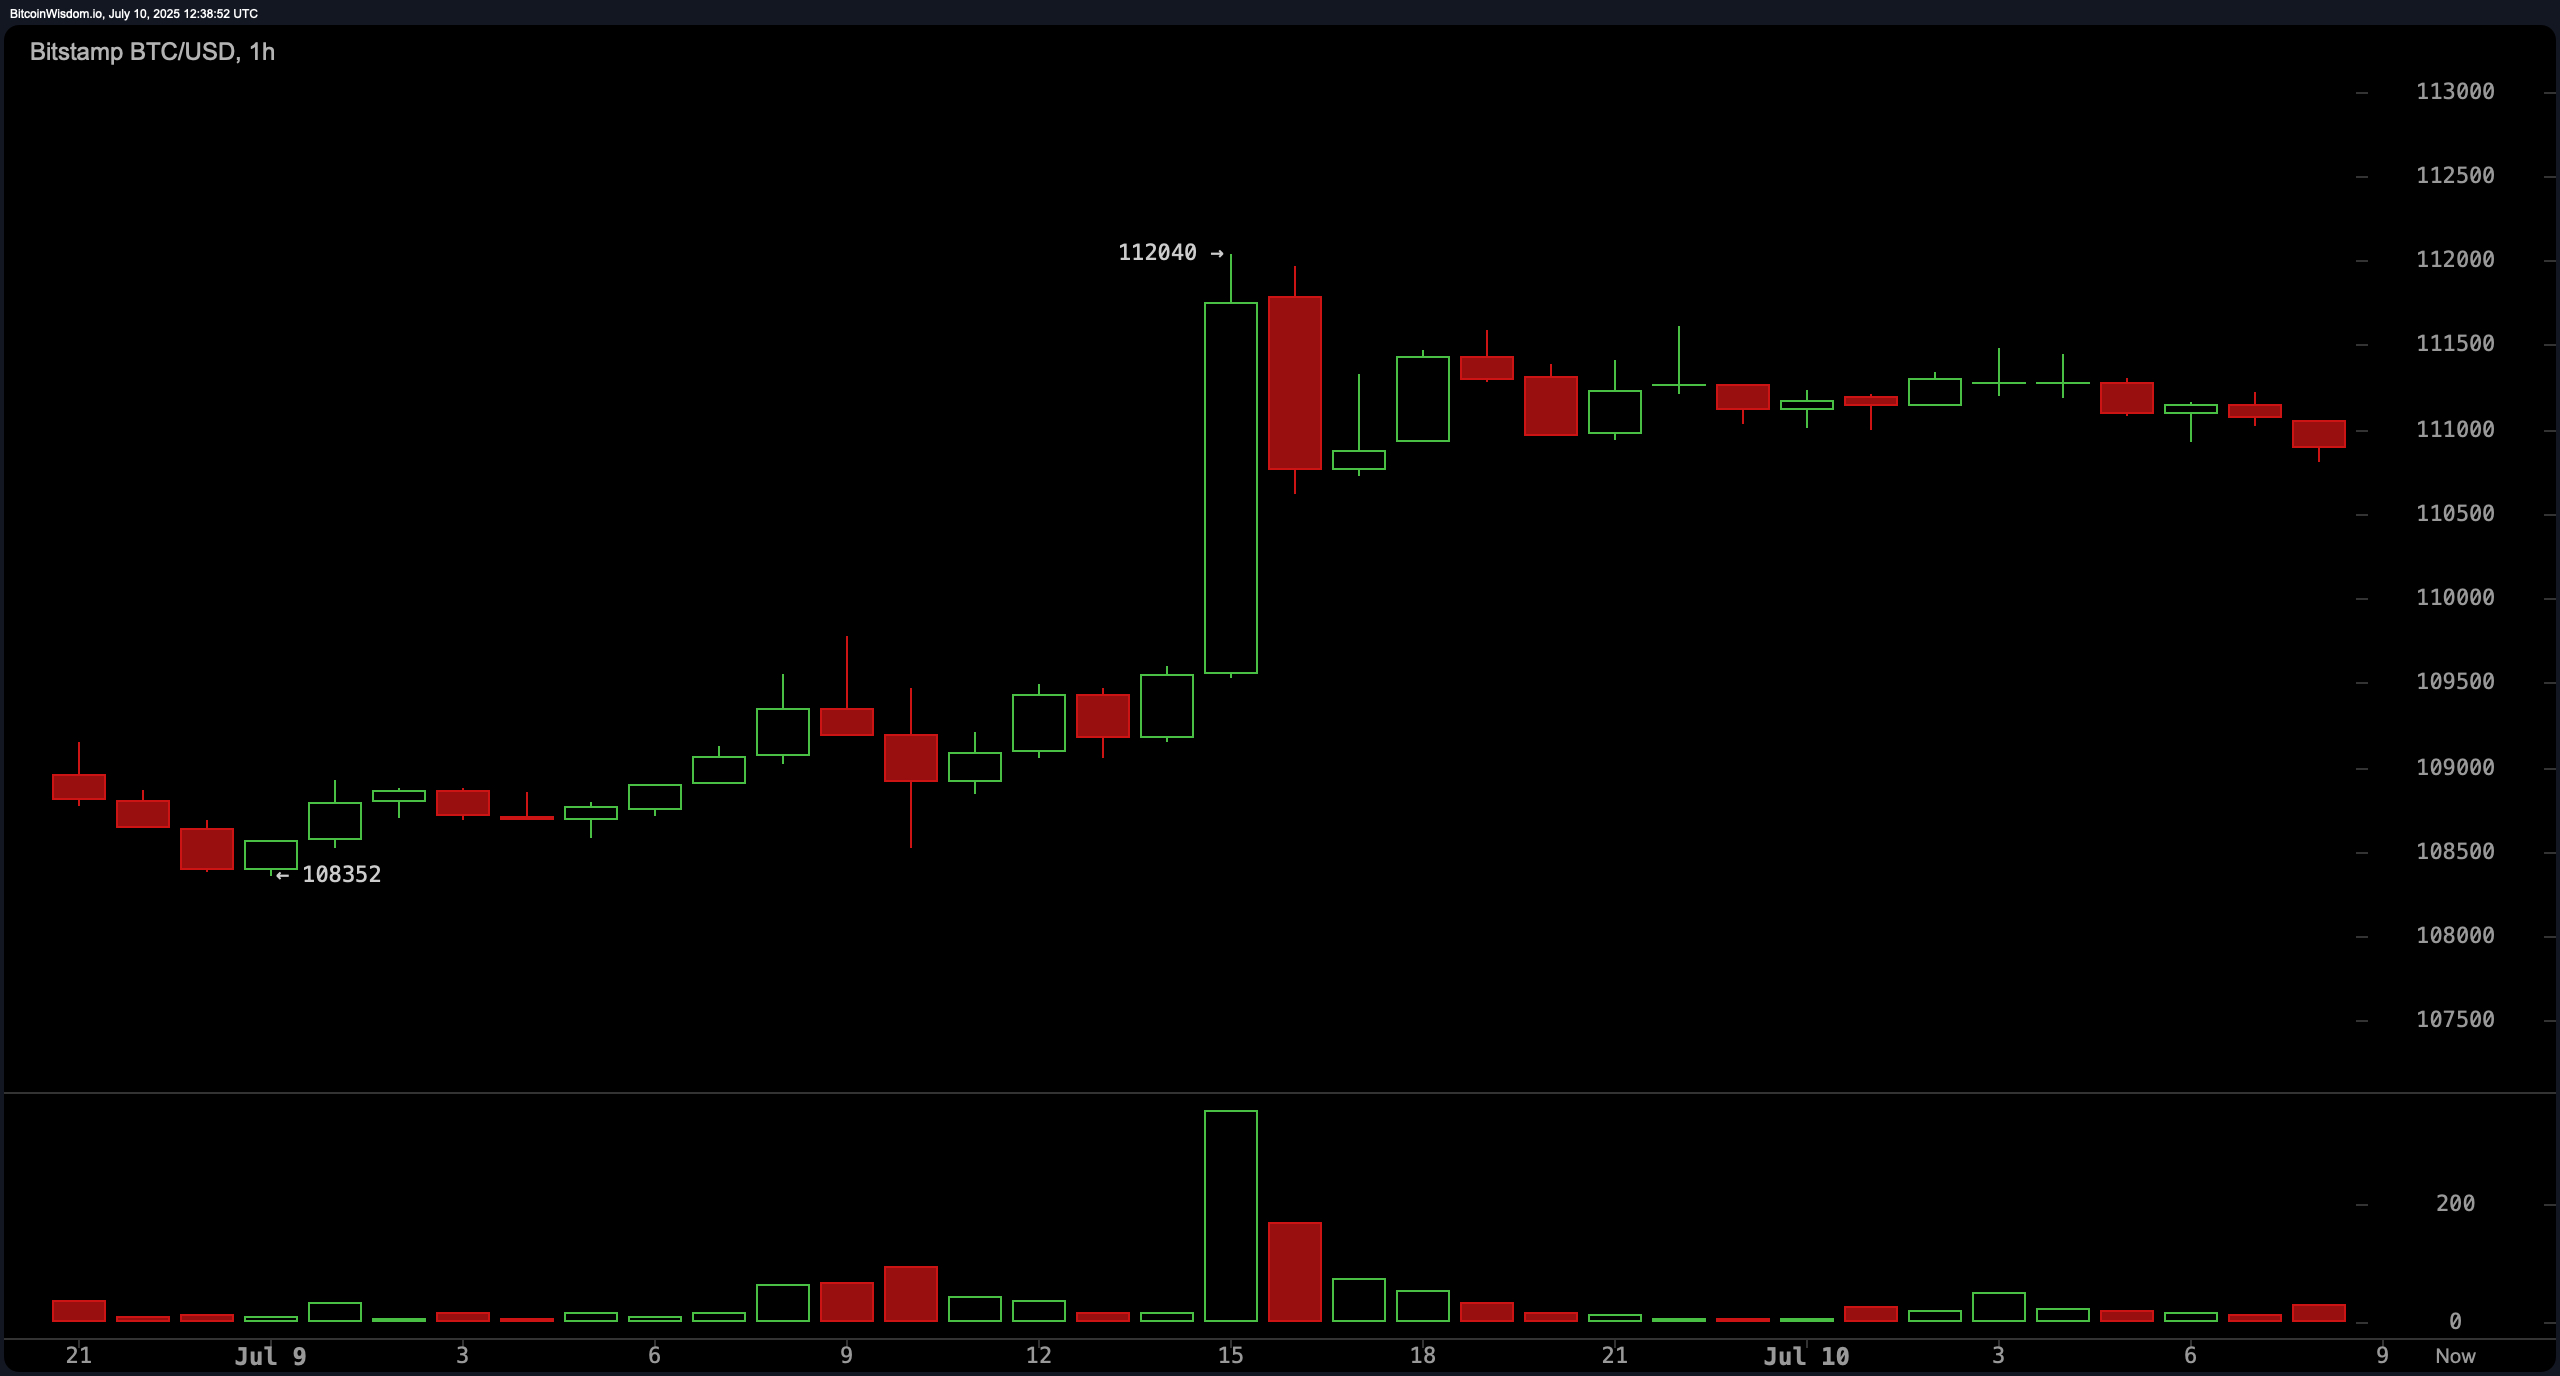
From the 1-hour chart perspective, bitcoin appears locked in a flat consolidation pattern after the initial vertical surge. Support around $110,800 has been repeatedly tested, while resistance near $111,800 remains intact, forming a tight trading corridor. The sharp decline in volume since the breakout highlights market hesitation and increases the probability of a short-term pullback. If support fails to hold, the price may retest previous breakout zones in the $109,000 range. Momentum, for now, is in limbo, awaiting directional cues.
Oscillators present a mixed yet cautious picture. The relative strength index (RSI) at 61 is neutral, while the Stochastic stands at 81, also neutral. The commodity channel index (CCI) at 146, average directional index (ADX) at 11, and Awesome oscillator at 2,681 further emphasize neutrality. However, the momentum indicator (10) at 3,722 and the moving average convergence divergence (MACD) level at 1,235 both indicate a buy, reflecting residual bullish pressure that has not yet fully dissipated.
Moving averages (MAs) continue to support the bullish bias, with all key averages — including the 10-period exponential moving average (EMA) at 109,128 and simple moving average (SMA) at 108,917 — giving buy signals. Longer-term indicators such as the 200-period EMA at 95,968 and SMA at 96,671 also align with the upward trend, reinforcing the strength of the broader market structure. Despite short-term hesitations, these indicators affirm that the prevailing trend remains bullish unless critical support levels give way.
Bull Verdict:
Bitcoin remains structurally sound above key moving averages, with momentum indicators like the momentum (10) and moving average convergence divergence (MACD) signaling continued buying interest. As long as price sustains above $110,000 and reclaims $112,000 with volume, the case for a bullish continuation targeting new highs remains intact. Consolidation may simply be a pause before the next leg up.
Bear Verdict:
Despite the strong rally to $112,040, bitcoin’s inability to sustain momentum and the current volume drop raise caution. The flat intraday trend and waning oscillator signals suggest the asset may be losing steam. A failure to hold above $110,800 — especially with no volume follow-through — could trigger a deeper retracement toward the $108,500–$109,000 range.