Bitcoin price ended the month above $82,000, is trading near $83,700, and is consolidating after a sharp recovery from the June lows. The rebound has brought $BTC back toward a crucial resistance zone but is yet to clear the $85,000 to $90,000 area. This is an important zone, as liquidation liquidity and large sell orders could make the next move harder. This setup leaves Bitcoin at an important technical crossroads, as a breakout above the range could open the door toward higher pivot levels.
Liquidation Liquidity Builds Above and Below the $BTC Price
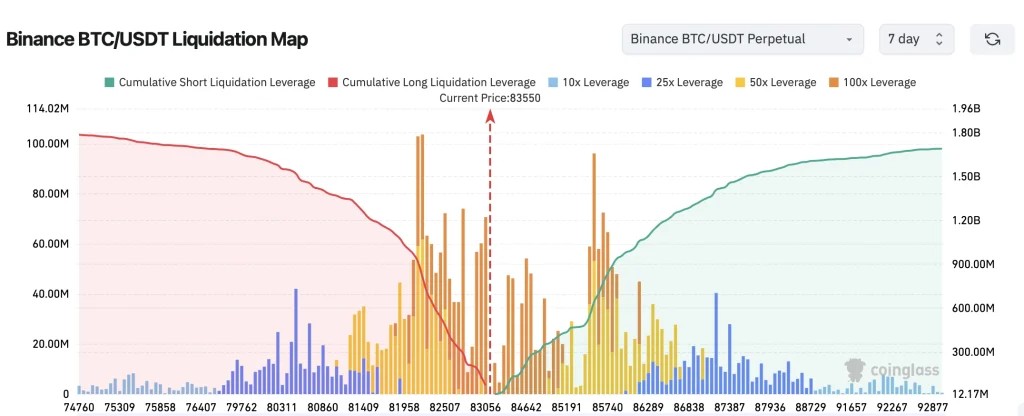
Bitcoin is surrounded by substantial potential liquidation liquidity. With the $BTC price trading around $83,700, the liquidation map shows significant clusters between $85,000 and $86,500, above the current range. Some of the largest individual liquidation concentrations appear around the mid-$85,000 level. This matters because a move through these levels could force leveraged short positions to close, accelerating upward action.

Know when your
coins moveAlerts, real-time prices, and market news — all in one app

4.8 based on 40K reviews in the App Store and Google Play


A breakout through the first liquidity cluster could trigger a cascade of short liquidations and increase momentum. On the other hand, large concentrations appear around $82,000 to $83,000, with additional liquidity extending toward the high near $70,000. Therefore, a move above $86,000 could begin squeezing shorts and accelerate a rise toward $90,000. Conversely, a decisive break below $82,000 could increase downside volatility toward the $80,000 to $78,000 range.
Large Sell Orders Create a Wall Towards $90,000
The Coinglass whale order chart shows substantial sell-side liquidity layered above the current market price. Large orders appear around $85,700, $87,000, $88,000, and $89,000, before a prominent concentration around $90,000. The visible order ladder shows more than $20 million in sell orders around the $90,000 level across the highlighted orders, while additional liquidity sits above $90,000.
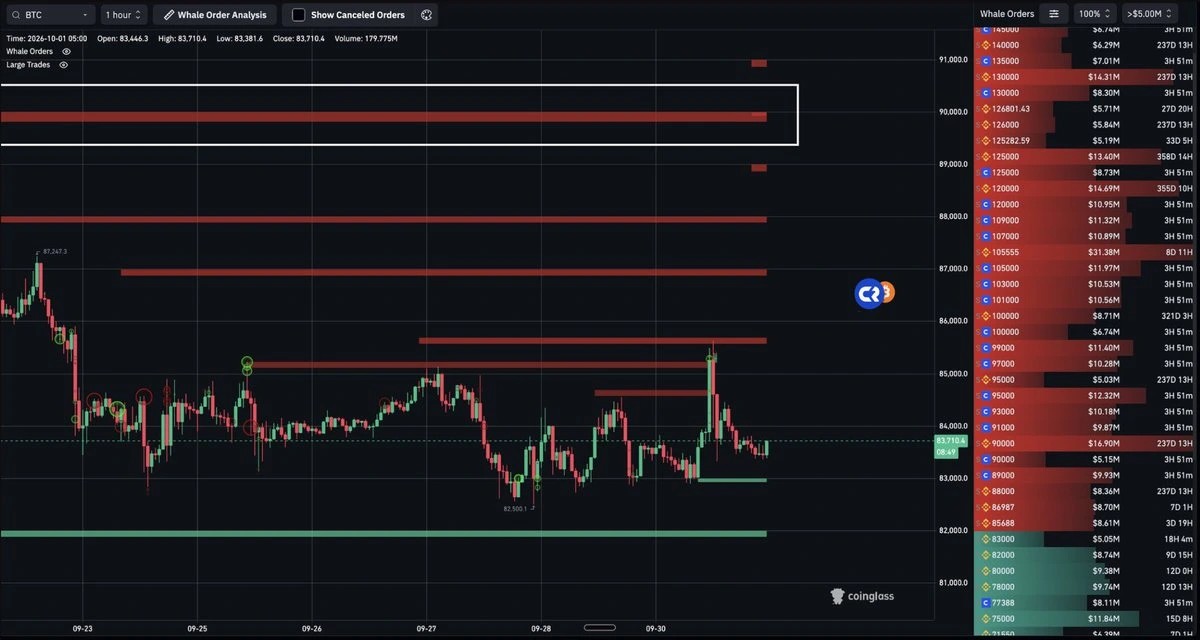
Bitcoin could therefore encounter selling pressure several times before reaching $90,000. First comes the $85,000 to $86,000 region, followed by additional supply around $87,000 to $89,000, and then the much larger psychological barrier at $90,000. This is seen as a potential overhead supply, not proof that specific whales are deliberately preventing Bitcoin from breaking higher.
Bitcoin Struggles to Break the Trend Line
The $BTC price is trading around $84,000, with the price consolidating after a strong recovery from the June-July lows. The price structure remains constructive as long as $BTC holds above the central pivot at nearly $81,996. The chart also shows an ascending trendline connecting recent lows, providing additional support underneath the price.
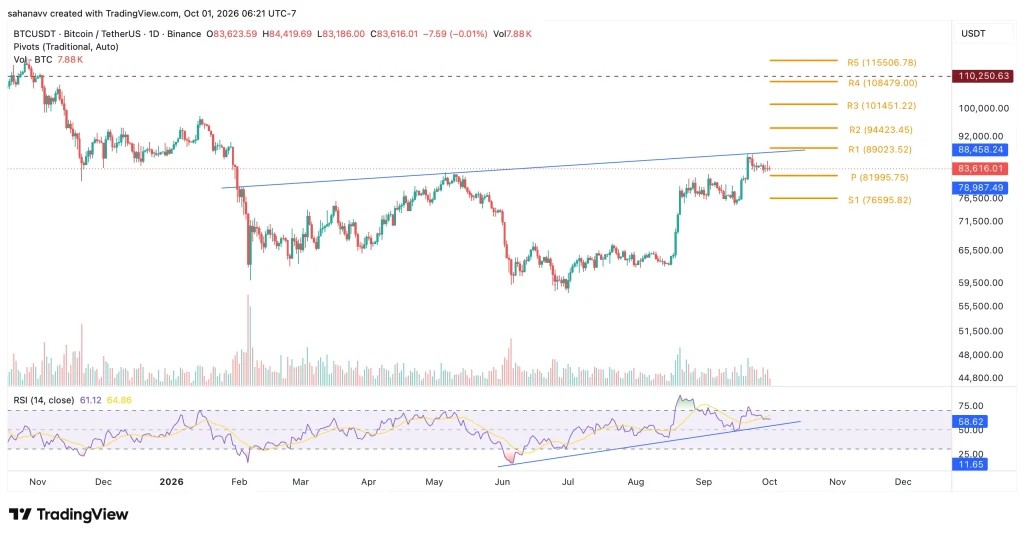
The momentum is also supportive, as RSI has been rising along the rising trendline. This suggests buyers retain momentum without the market yet showing an extreme RSI reading. The immediate hurdle is the R1 pivot at $89,024, and a daily close above this level would put the psychological $90,000 threshold within reach. On the downside, $81,996 is the first major support, followed by $76,596.
What’s Next for the Bitcoin Price Rally?
Bitcoin price has entered the Q4 2026 trade at a key inflexion point. The recovery is still intact, but the market needs to prove that buyers can absorb the supply sitting above the current price. Until that happens, $BTC could remain choppy as traders wait for a decisive breakout or rejection. Therefore, if resistance continues to hold, another period of consolidation or a deeper pullback cannot be ruled out. For now, Q4 begins with Bitcoin at a crucial decision point, where the next breakout could determine the direction of the broader trend.