Bitcoin’s rally is approaching a $90,000 test as a rare accumulation pattern reappears and sell-side liquidity thins.
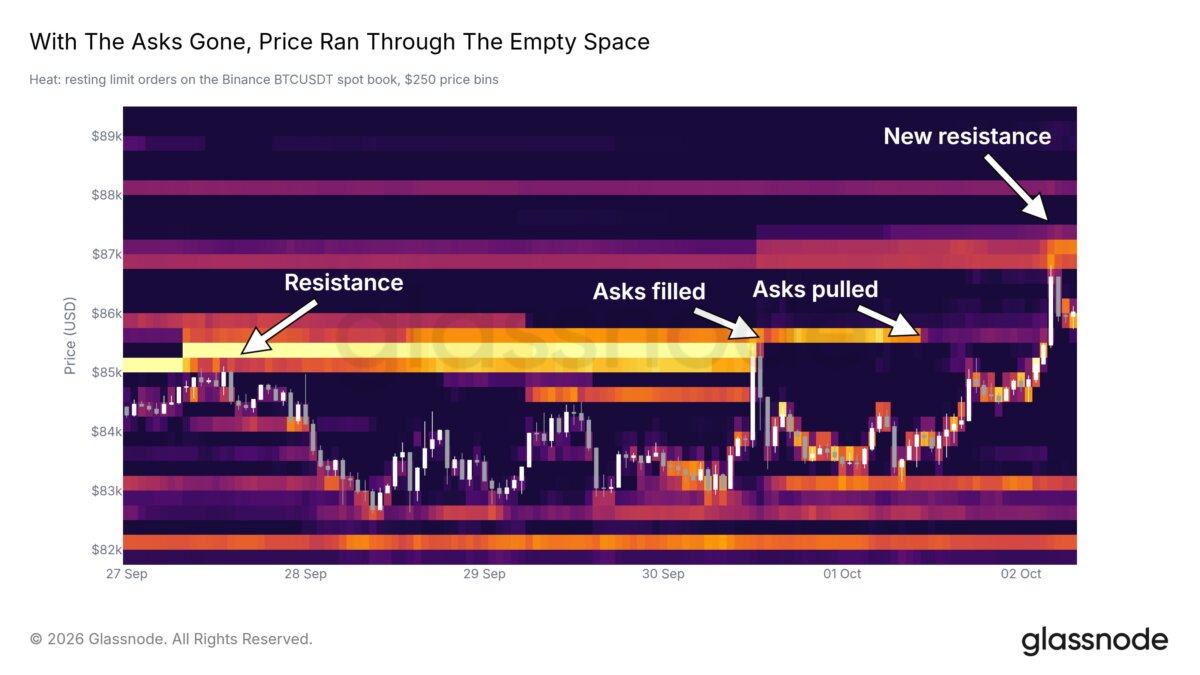
On Oct. 2, Bitcoin registered an intraday high at $87,000 after buyers broke through a sell wall around $85,000 that had stalled several previous attempts to advance.
Glassnode said some of those orders were filled and the remainder withdrawn, leaving a smaller concentration of asks around $87,000 and less visible liquidity immediately above.

Know when your
coins moveAlerts, real-time prices, and market news — all in one app

4.8 based on 40K reviews in the App Store and Google Play


At the same time, bands on CryptoQuant’s Bitcoin Accumulation Trend chart have begun contracting, reviving a pattern seen before two sharp advances in 2025.
The setup adds another bullish signal to a market that has reclaimed several key cost-basis levels, though the limited number of previous occurrences makes the pattern far from conclusive.
Past contractions offer a bullish, but limited, precedent
Per CryptoQuant, the current contraction resembles two episodes in 2025 followed by sizable gains, giving traders a bullish analog as Bitcoin enters October.
The Accumulation Trend tracks buying and selling behavior across different groups of Bitcoin holders, offering a view into whether supply is being absorbed or distributed. Periods when the chart’s bands narrow sharply have previously coincided with shifts in market momentum.
One contraction occurred between April 17 and April 20, 2025, when Bitcoin traded near $84,000. $BTC subsequently climbed toward $109,000, and another appeared between March 5 and March 8 before a separate advance.
Those episodes are too few to establish the contraction as a reliable forecasting tool. However, they do make the latest occurrence more notable because Bitcoin’s broader market structure has improved at the same time.
Bitwise said this week that Bitcoin has reclaimed the major cost-basis thresholds it tracks for identifying shifts toward risk-on conditions. Those include the short-term holder cost basis near $73,000, a true market mean around $77,000, and the estimated average cost basis of spot exchange-traded fund investors near $83,000.
Bitcoin has also moved decisively through Bitwise’s $85,000 short-term holder realized-price band, pushing the market toward a part of the distribution where gains have historically become harder to sustain.
Underwater Bitcoin holders crowd the path toward $100,000
The disappearance of the $85,000 sell wall leaves Bitcoin heading directly toward another source of potential supply: investors approaching breakeven after months of losses.
CryptoQuant analyst Darkfost estimates that $BTC holders who acquired their assets 18 months to two years ago have an average cost basis near $88,350. The six-to-12-month cohort sits around $89,200 and has been underwater overall for close to a year.
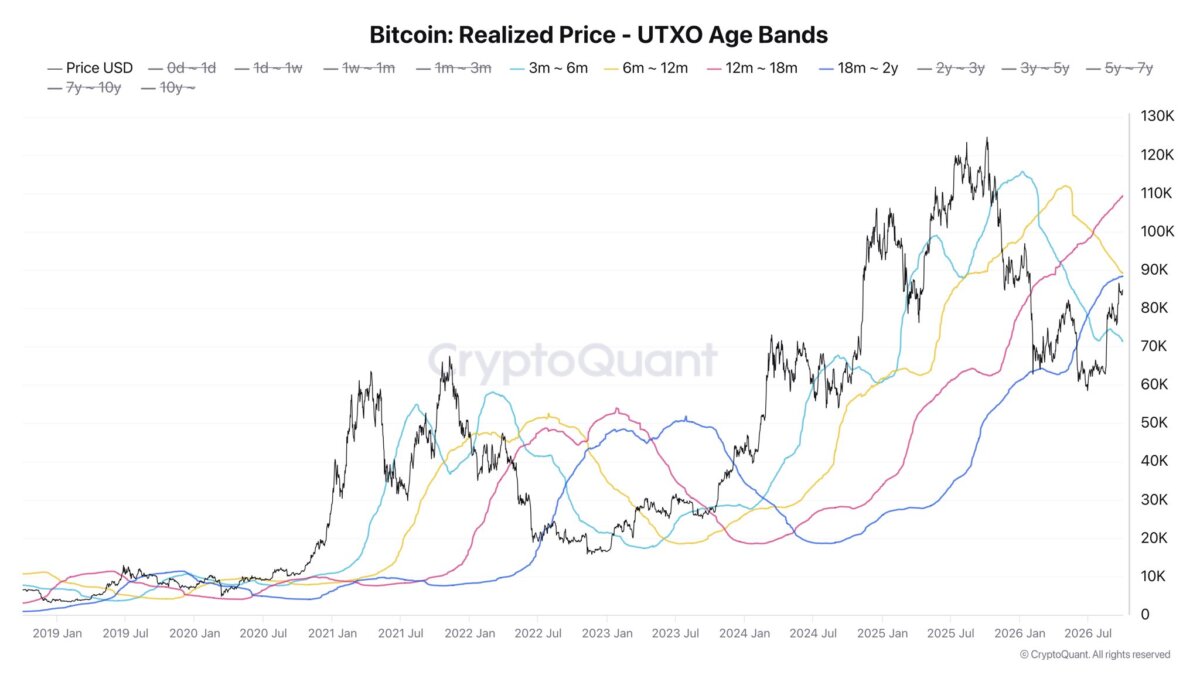
Some investors bought above these averages and others below, but as the market approaches the cohort’s cost bases, more holders face a fresh decision after months in losses.
Some may use the recovery to exit near breakeven, while others could hold or add to lower their average purchase price. How much of that returning supply buyers absorb will help determine whether the rally can extend beyond $90,000.
Bitwise’s valuation bands place another hurdle in almost the same area.
The firm puts the next short-term holder reference level around $90,000, or 1.5 standard deviations above realized price, followed by the two-standard-deviation level around $95,000. Bitcoin has traded above those thresholds on only about 3.8% and 1.7% of days, respectively, in Bitwise’s historical sample.
A separate Fibonacci framework used by the asset manager places levels near $92,000 and $100,000, adding to the concentration of technical and on-chain markers across the region. Bitwise described $90,000 to $100,000 as the next area where several structural reference points converge.
Options traders are positioning for the same corridor. Deribit data show about $2.1 billion of Bitcoin call exposure at the $90,000 strike, $2.4 billion at $95,000 and $1.8 billion at $100,000.
The concentration of calls points to substantial demand for upside exposure as Bitcoin moves closer to those strikes.
Their effect on the spot market will depend on expiration dates and dealer hedging, but the positioning shows that traders have placed billions of dollars behind a move into the same $90,000-to-$100,000 range highlighted by on-chain valuation measures.
Leverage rebuilds as macro pressure eases
Bitcoin is approaching that supply zone with speculative exposure rising again and Friday’s US employment report giving risk assets a fresh macro boost.
Bitcoin’s open interest fell to about $52 billion as September ended, but derivatives activity has begun recovering, with the figure climbing to roughly $56.2 billion in the first two days of October, CoinGlass data show.
The roughly $4.2 billion increase coincided with Bitcoin rising from about $83,500 to briefly above $87,000.
The rebound suggests traders are rebuilding exposure after cutting positions into the end of September. With open interest rising alongside Bitcoin, new positions have accompanied the price advance, although the measure alone does not show whether traders are positioned long or short.
Bitcoin open interest ended September near its lowest level in a year, leaving room for speculative activity to rebuild without immediately returning to previous extremes. Rising funding nevertheless makes long positions more expensive to maintain and increases their vulnerability if the rally reverses.
The macro backdrop turned more favorable Friday after US employers added just 29,000 jobs in September, well below the 90,000 economists had expected. The unemployment rate increased to 4.2% from 4.1%, while August payroll growth was revised lower.
The report pushed down expectations that the Federal Reserve will raise rates again at its October meeting, sending Treasury yields lower and lifting US equities. Futures markets placed the probability of an October increase below 20% following the data.
That removes one immediate threat to Bitcoin’s advance while leaving the harder test inside the crypto market itself.
A sustained move through $90,000 would take Bitcoin into territory that Bitwise already considers historically stretched relative to recent investor cost bases. Reaching $95,000 would push it into a band exceeded on less than 2% of days in the firm’s sample, forcing buyers to absorb both returning holder supply and increasingly expensive leveraged positions.
Failure to do so would shift attention back toward $83,000, where Bitwise places the average ETF investor cost basis and the first major downside level that bulls would need to defend.