
The crypto market is experiencing extreme volatility, with Bitcoin (BTC) being down 6% on the weekly chart and whales dumping around $3.45 billion worth of the cryptocurrency over the same period.
While these so-called bear traps are typically indicative of long-term bull cycles, it is still far from clear where the digital hedge is going to be heading in the following weeks, especially with weakening retail sentiment.
BTC price prediction
To set a BTC price target for September 1, Finbold’s AI prediction agent used multiple LLMs to generate an average forecast for improved accuracy while incorporating momentum-based indicators into its context.
Based on the AI’s predictions, the average BTC price on September 1 will be $111,867, implying a 1.18% downside from the current price of $113,157.
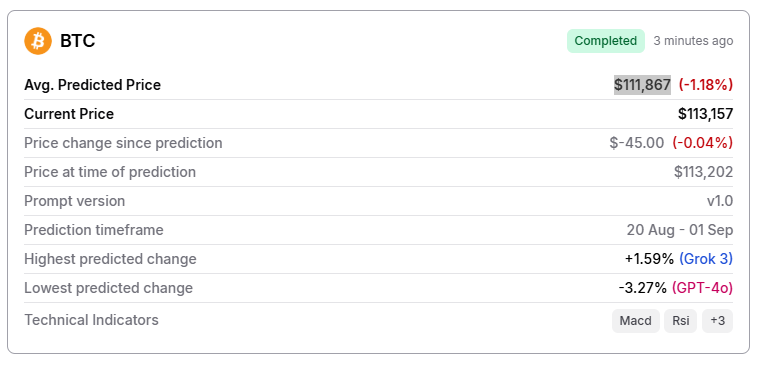
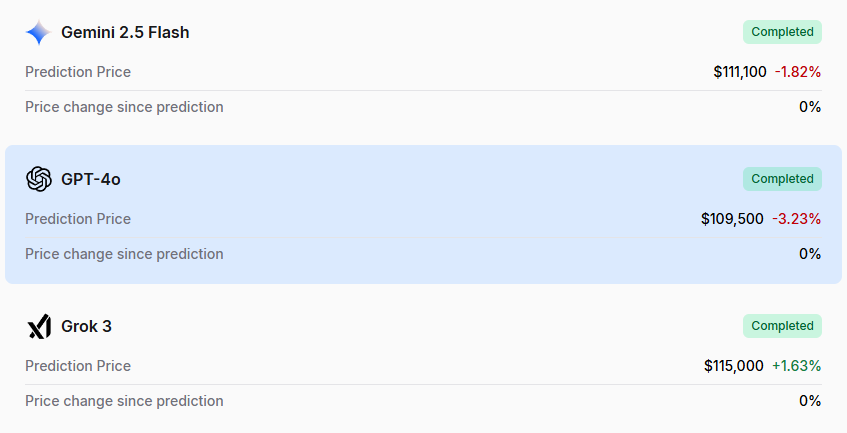
Among the three LLMs used in the prediction, only Grok 3 had an optimistic outlook. xAI’s assistant predicted Bitcoin would trade at $115,000 by the end of the month, which suggests a potential upside of 1.63%.
Gemini 2.5 and GPT-4o, on the other hand, were bearish. Google’s model forecasted a price of $111,100, seeing a potential downside of 1.82%, while its OpenAI counterpart went even lower, with a price of $109,500 and a downside potential of 3.23%.
On the technical front, Bitcoin is showing continued weakness below its 50-day simple moving average of $116,007. The moving average convergence divergence (MACD) line also sits at -117.35, well below the signal line at 557.6, while the histogram reads -675, signaling accelerating downside momentum.
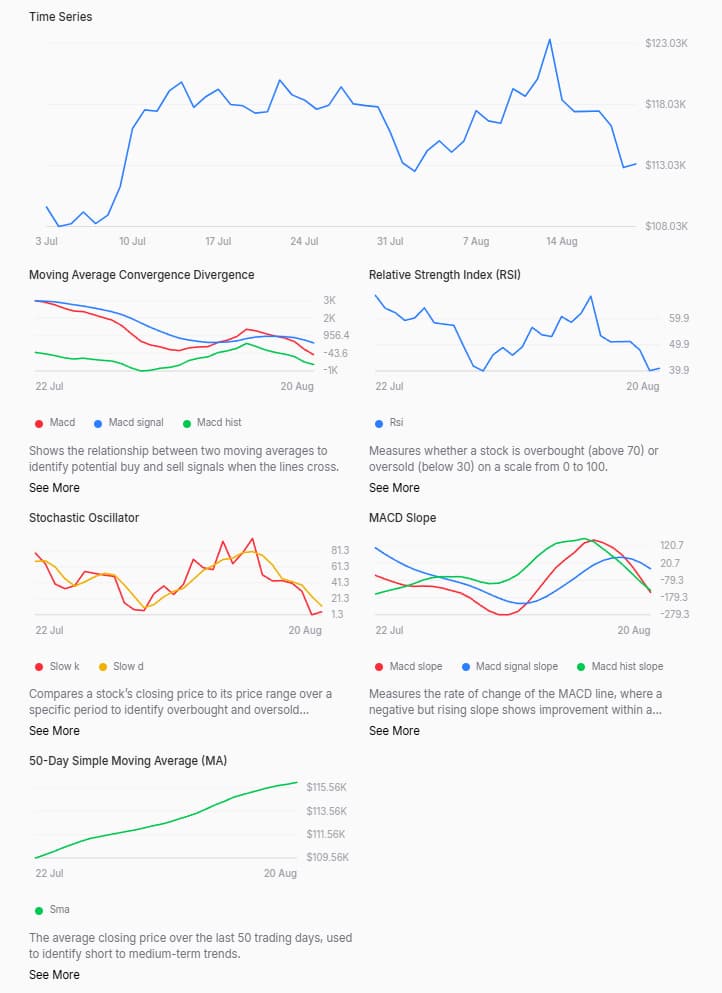
Meanwhile, the Relative Strength Index (RSI) is at 41, indicating the cryptocurrency is weak but not yet in oversold territory. The Stochastic oscillator, however, does point to oversold conditions with the slow_k and slow_d lines at 5.02 and 12.38, respectively.
Moreover, the 50-Day Simple Moving Average (MA) at $116,007 remains a key resistance level. Failure to reclaim this level could extend the downward trend toward support zones near $112,000 to $110,000.
Featured image via Shutterstock