Bitcoin’s price is on the verge of breaking below another key level, after failing to regain momentum following its all-time high a couple of weeks ago. Investors are now worried that its price action might soon put an end to the entire crypto bull market.
BTC Price: Technicals
By Shayan
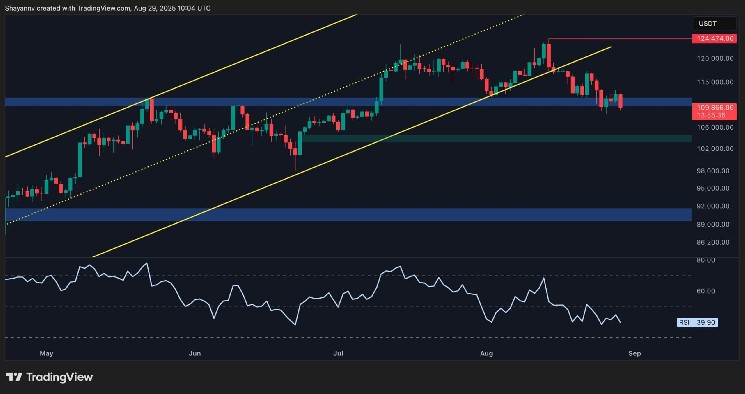
The Daily Chart
On the daily chart, the asset has been dropping gradually since hitting the $124K all-time high, with August potentially closing bearish. This is a worrying sign for investors, as the price is now breaking below the key $110K level, which could drag the price toward the $104K region and potentially even below $100K.
The RSI is also stabilizing below 50, indicating the dominance of bearish momentum. As a result, further downside looks more probable at the moment, unless market dynamics change drastically.
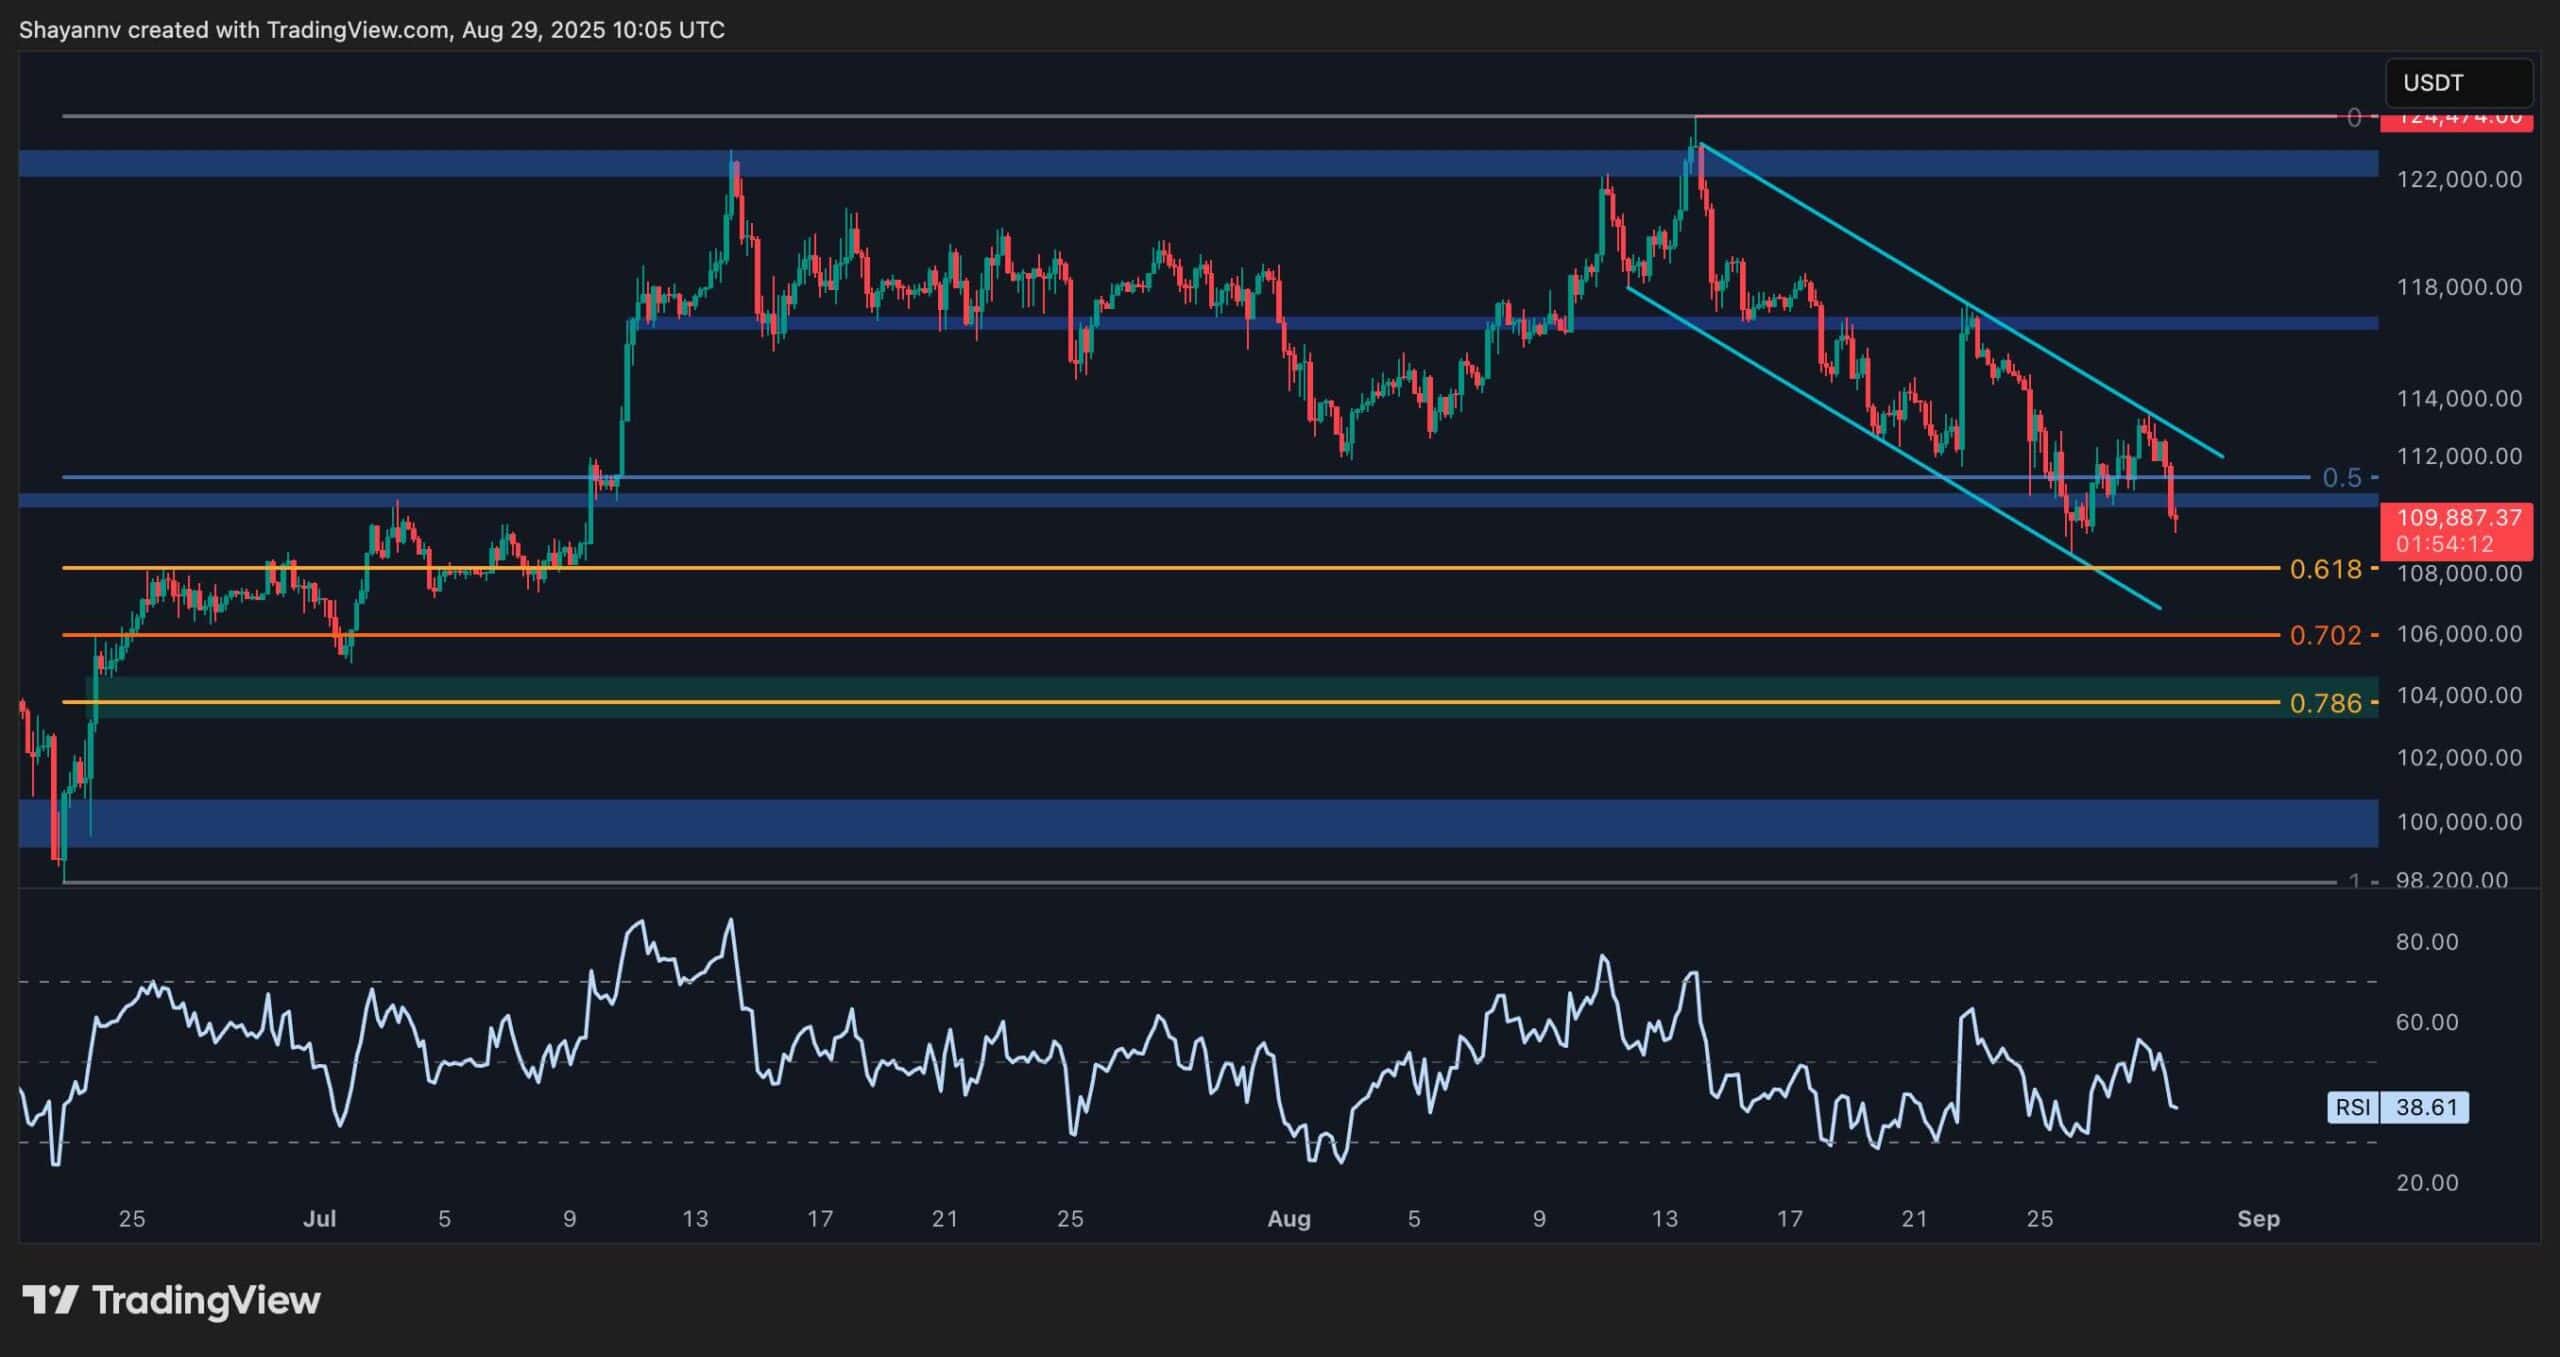
The 4-Hour Chart
Dropping down to the 4-hour chart, things get a bit more interesting. The asset has been declining inside a steep descending channel over the past couple of weeks, breaking below major support levels. With the $110K level breaking down, investors are looking at the key FVG located at $104K. This level coincides with the lower bound of the Fibonacci golden zone, which reinforces its importance.
With the RSI also indicating clear bearish momentum, if the $104K zone is also lots, a lower low below $100K could be imminent, as well as a bearish trend for the coming weeks.
Onchain Analysis
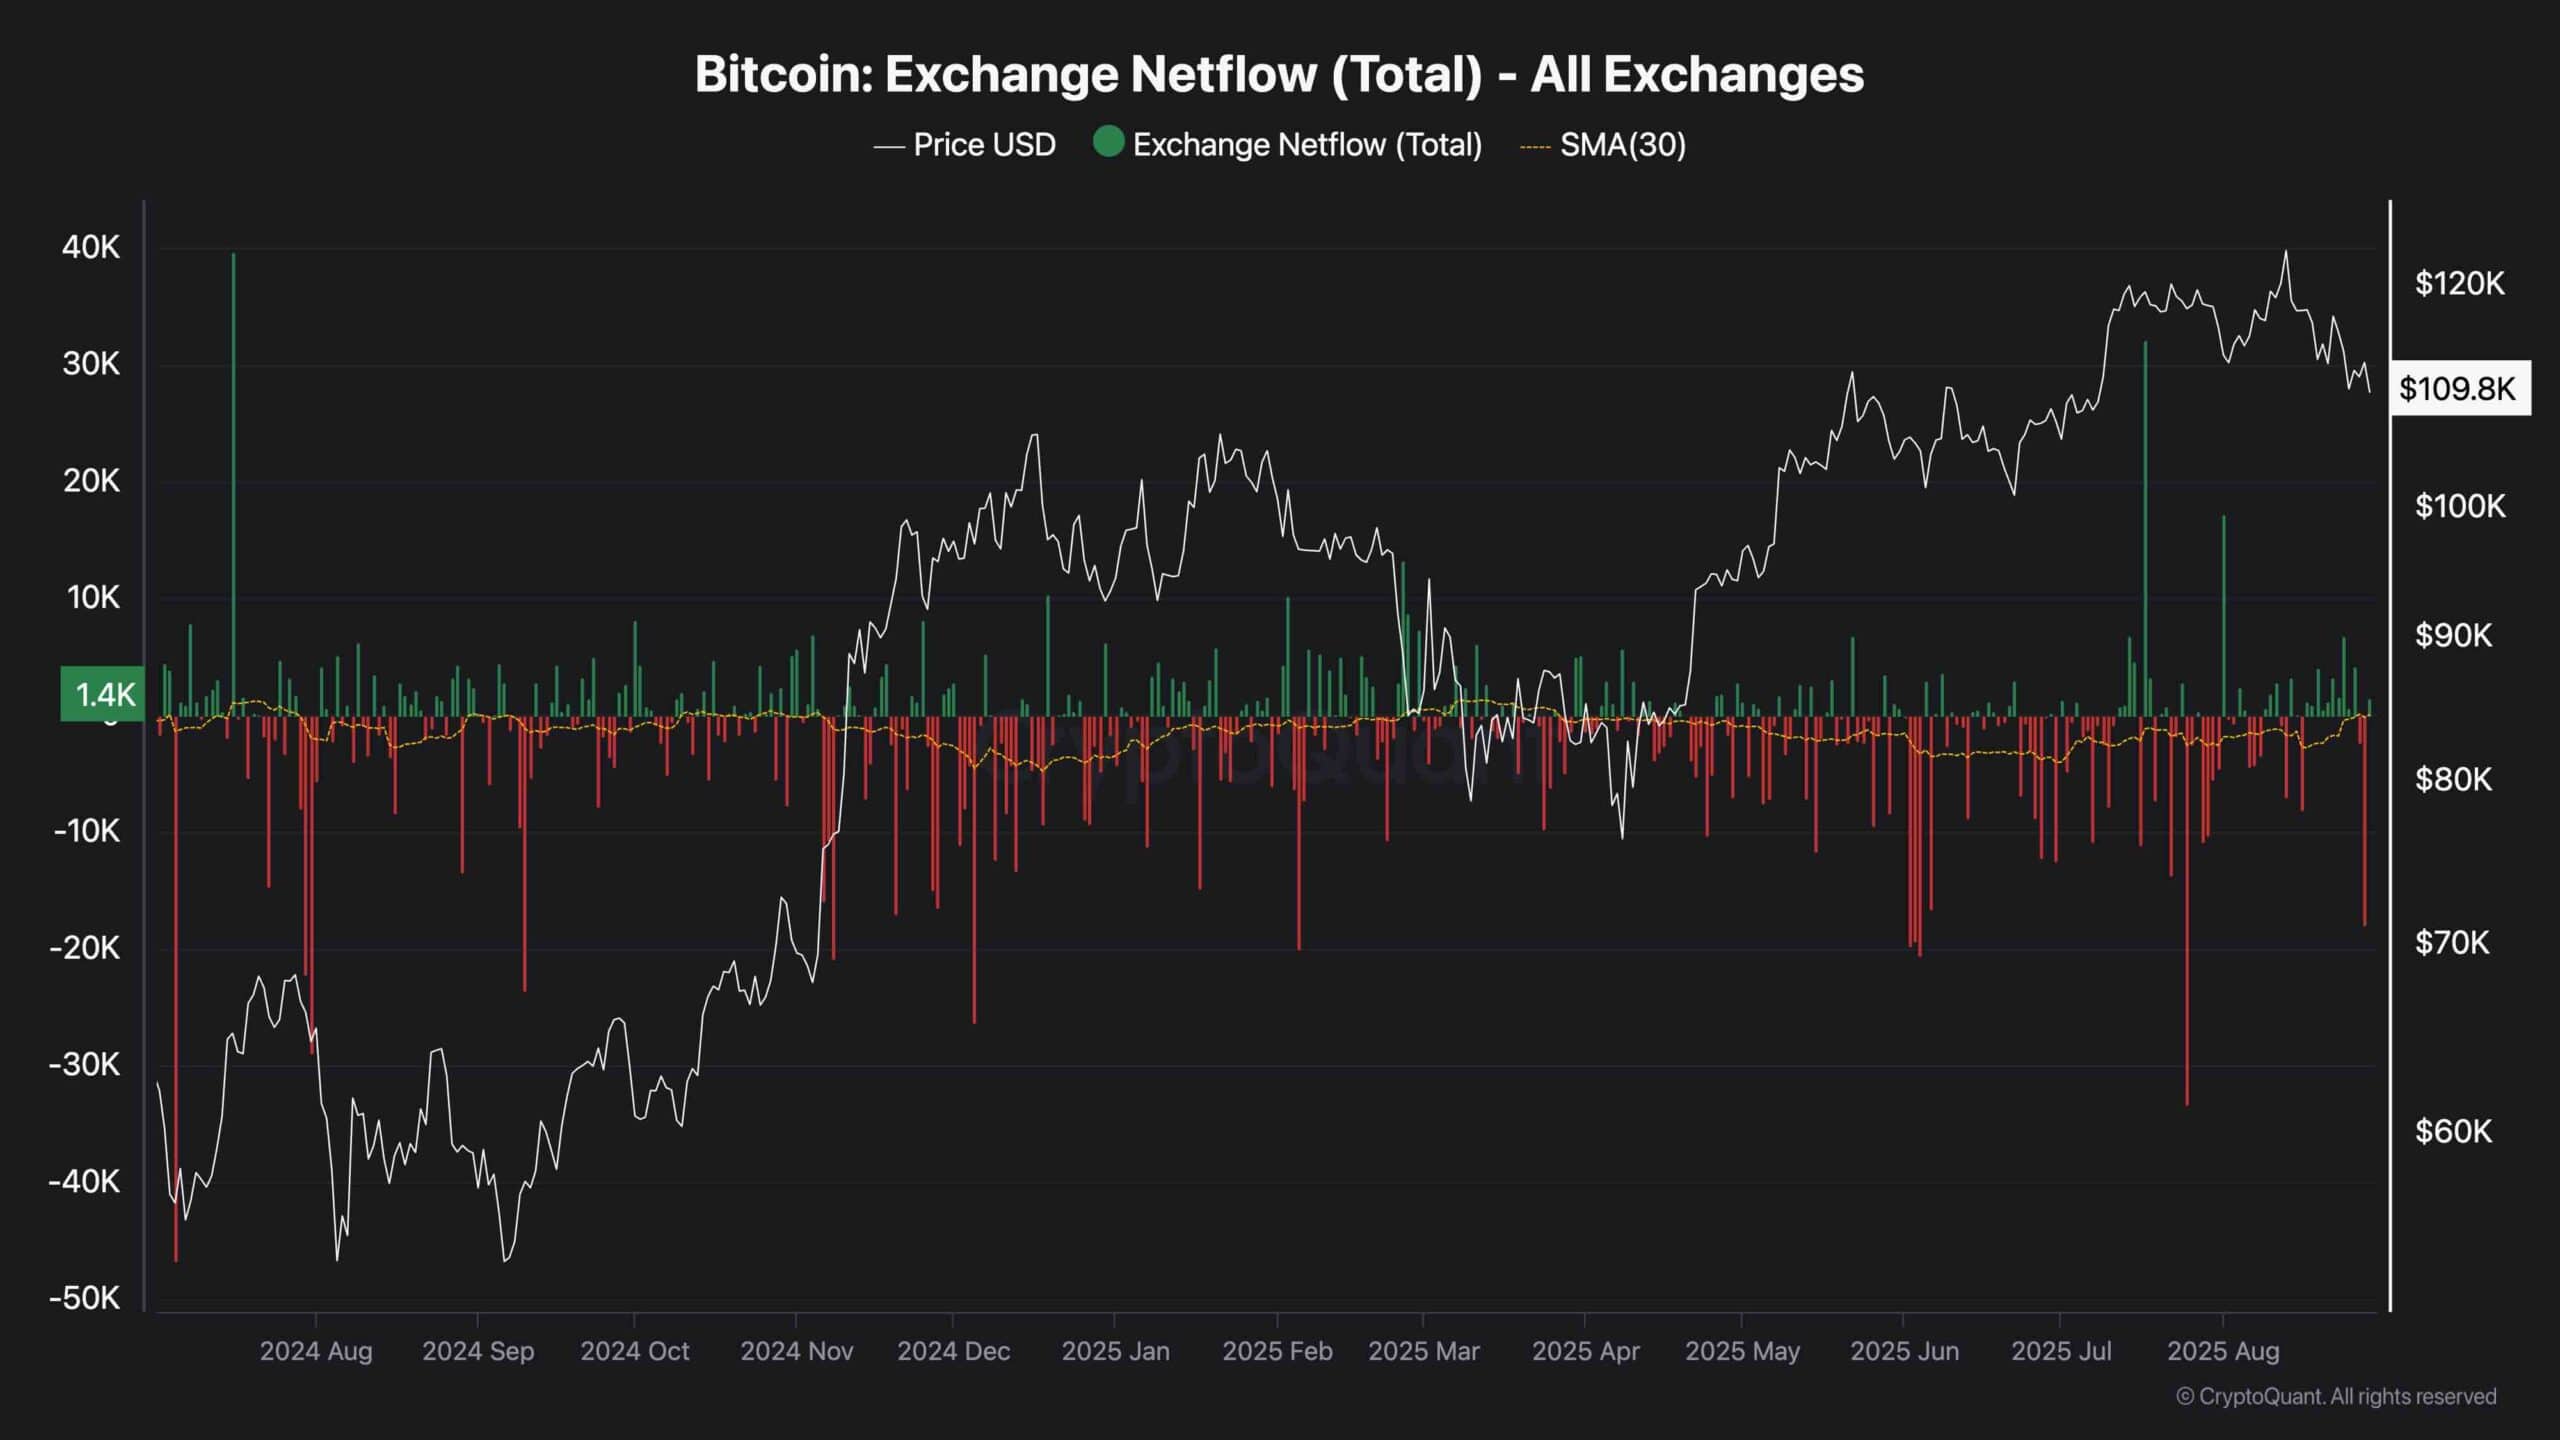
Exchange Netflow (30-day moving average)
The chart shows that since April, exchange netflows have leaned more bearish than bullish, with the 30-day moving average consistently sitting in negative territory.
This means more Bitcoin has been leaving exchanges than entering, which often signals investor preference for holding rather than preparing to sell. The overall trend aligns with a decline in available exchange reserves, suggesting a supply squeeze may be developing beneath the surface.
At the same time, while there have been isolated days of large inflows into exchanges, they have been countered by equally strong outflows. This balance reinforces the idea that short-term spikes in selling pressure have not been enough to reverse the broader accumulation trend.
As long as reserves continue to drop and coins move off exchanges, it indicates that long-term holders are still confident, and this underlying accumulation could provide support for price over the coming months. This is, of course, if it overwhelms the selling pressure from the futures market.