
The end of the week is mainly bearish, according to CoinStats.
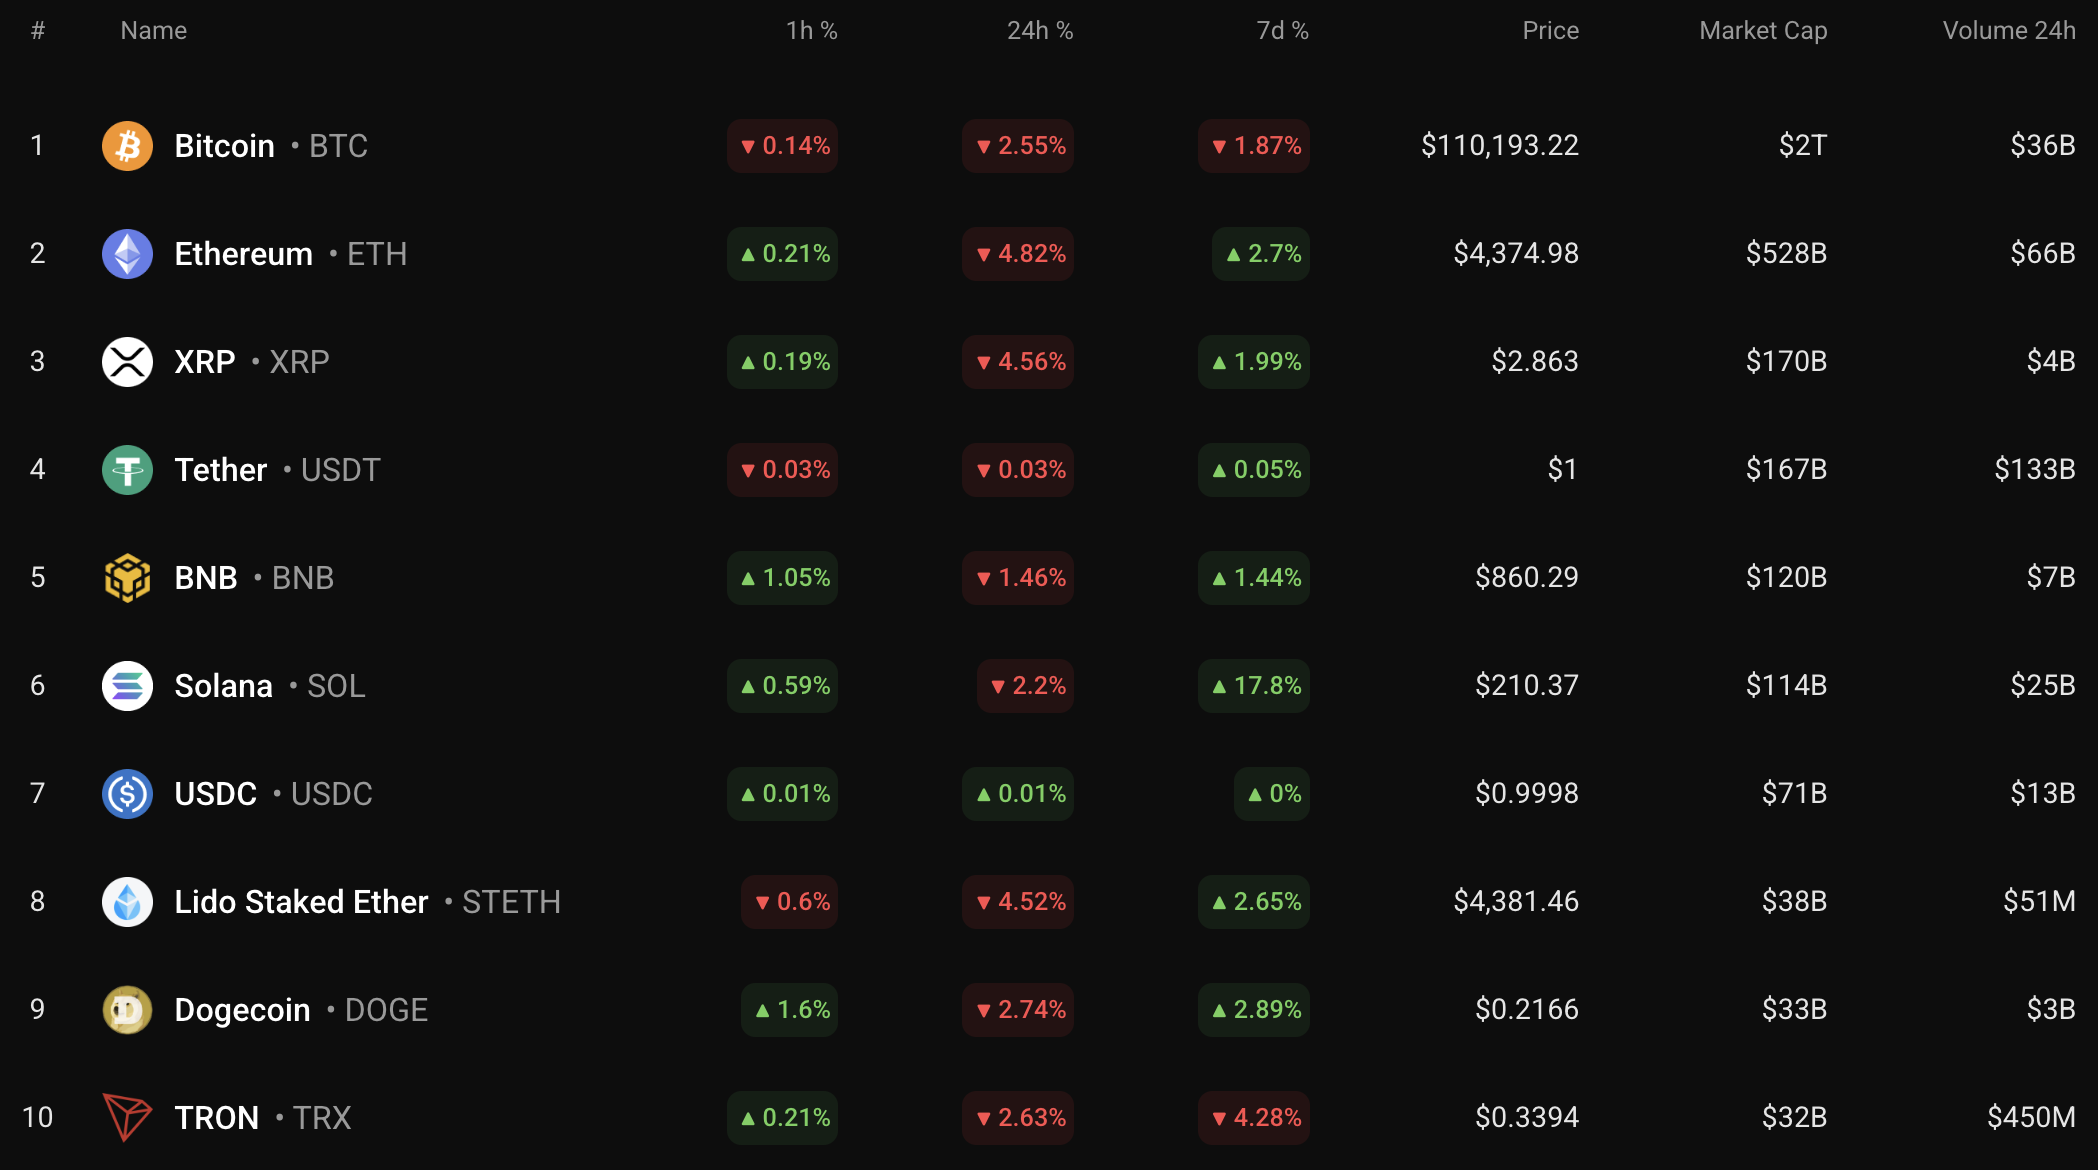
BTC/USD
The rate of Bitcoin (BTC) has declined by 2.55% over the last day.
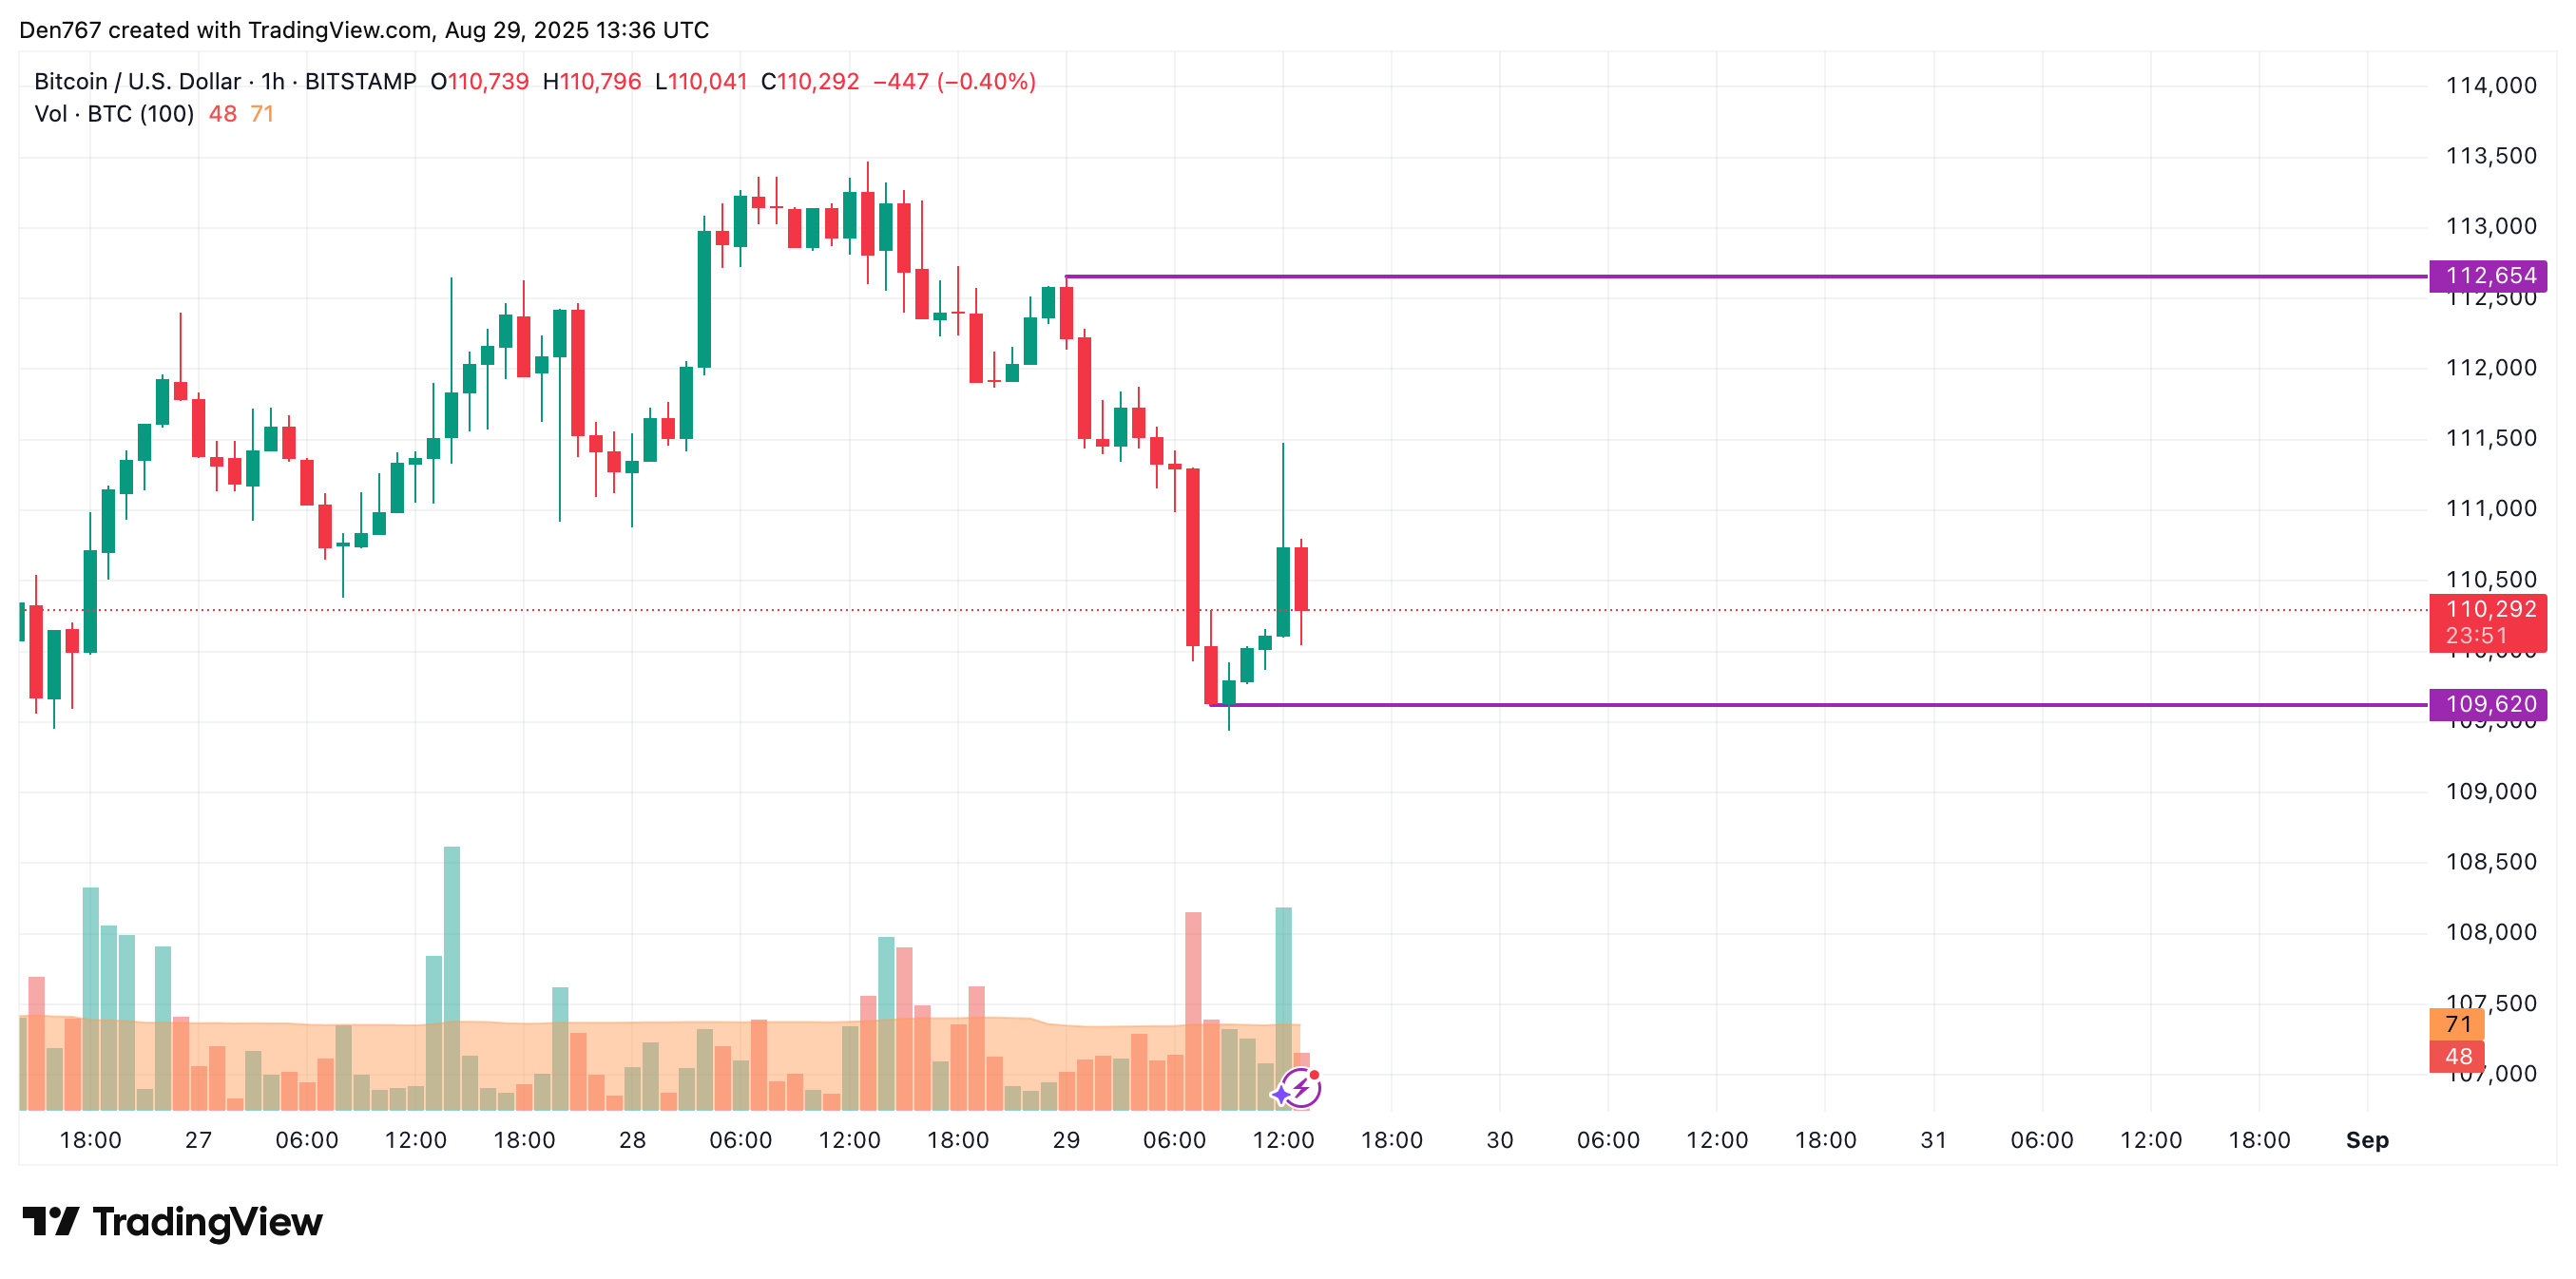
On the hourly chart, the price of BTC has made a false breakout of the local support. However, if sellers’ pressure continues and the candle closes near $109,620, there is a chance to see a test of the $109,000 mark soon.
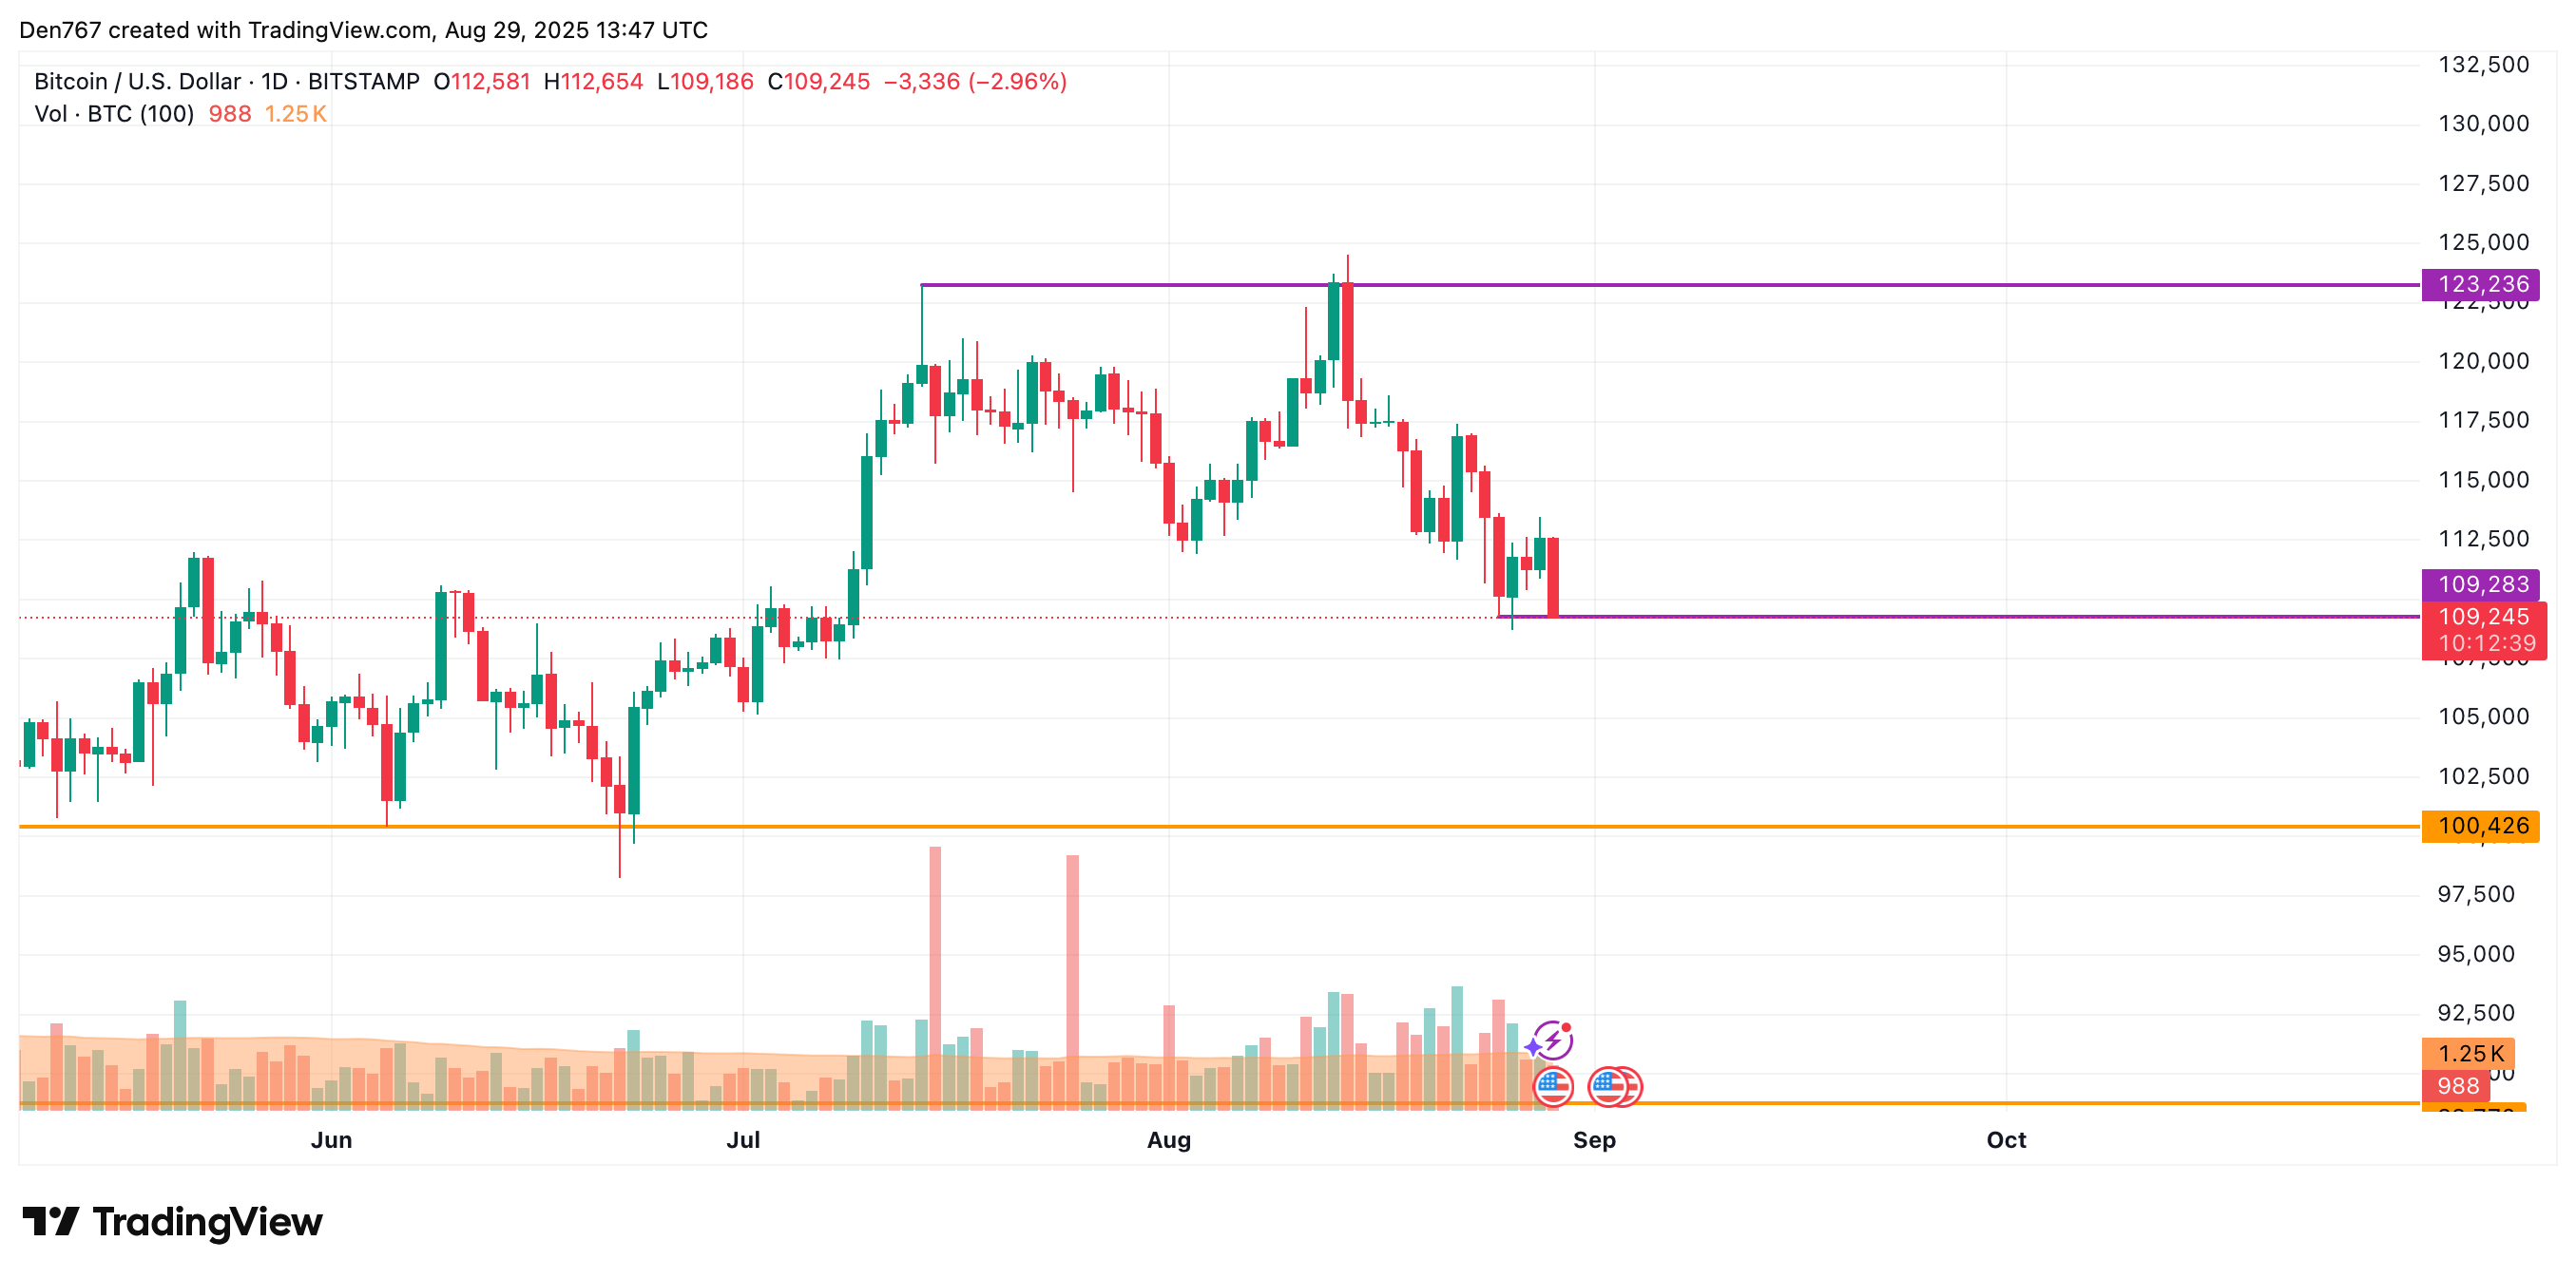
On the longer time frame, the rate of the main crypto is breaking the support of $109,823.
If the bar closes below that mark, the accumulated energy might be enough for a further drop to the $105,000 area.
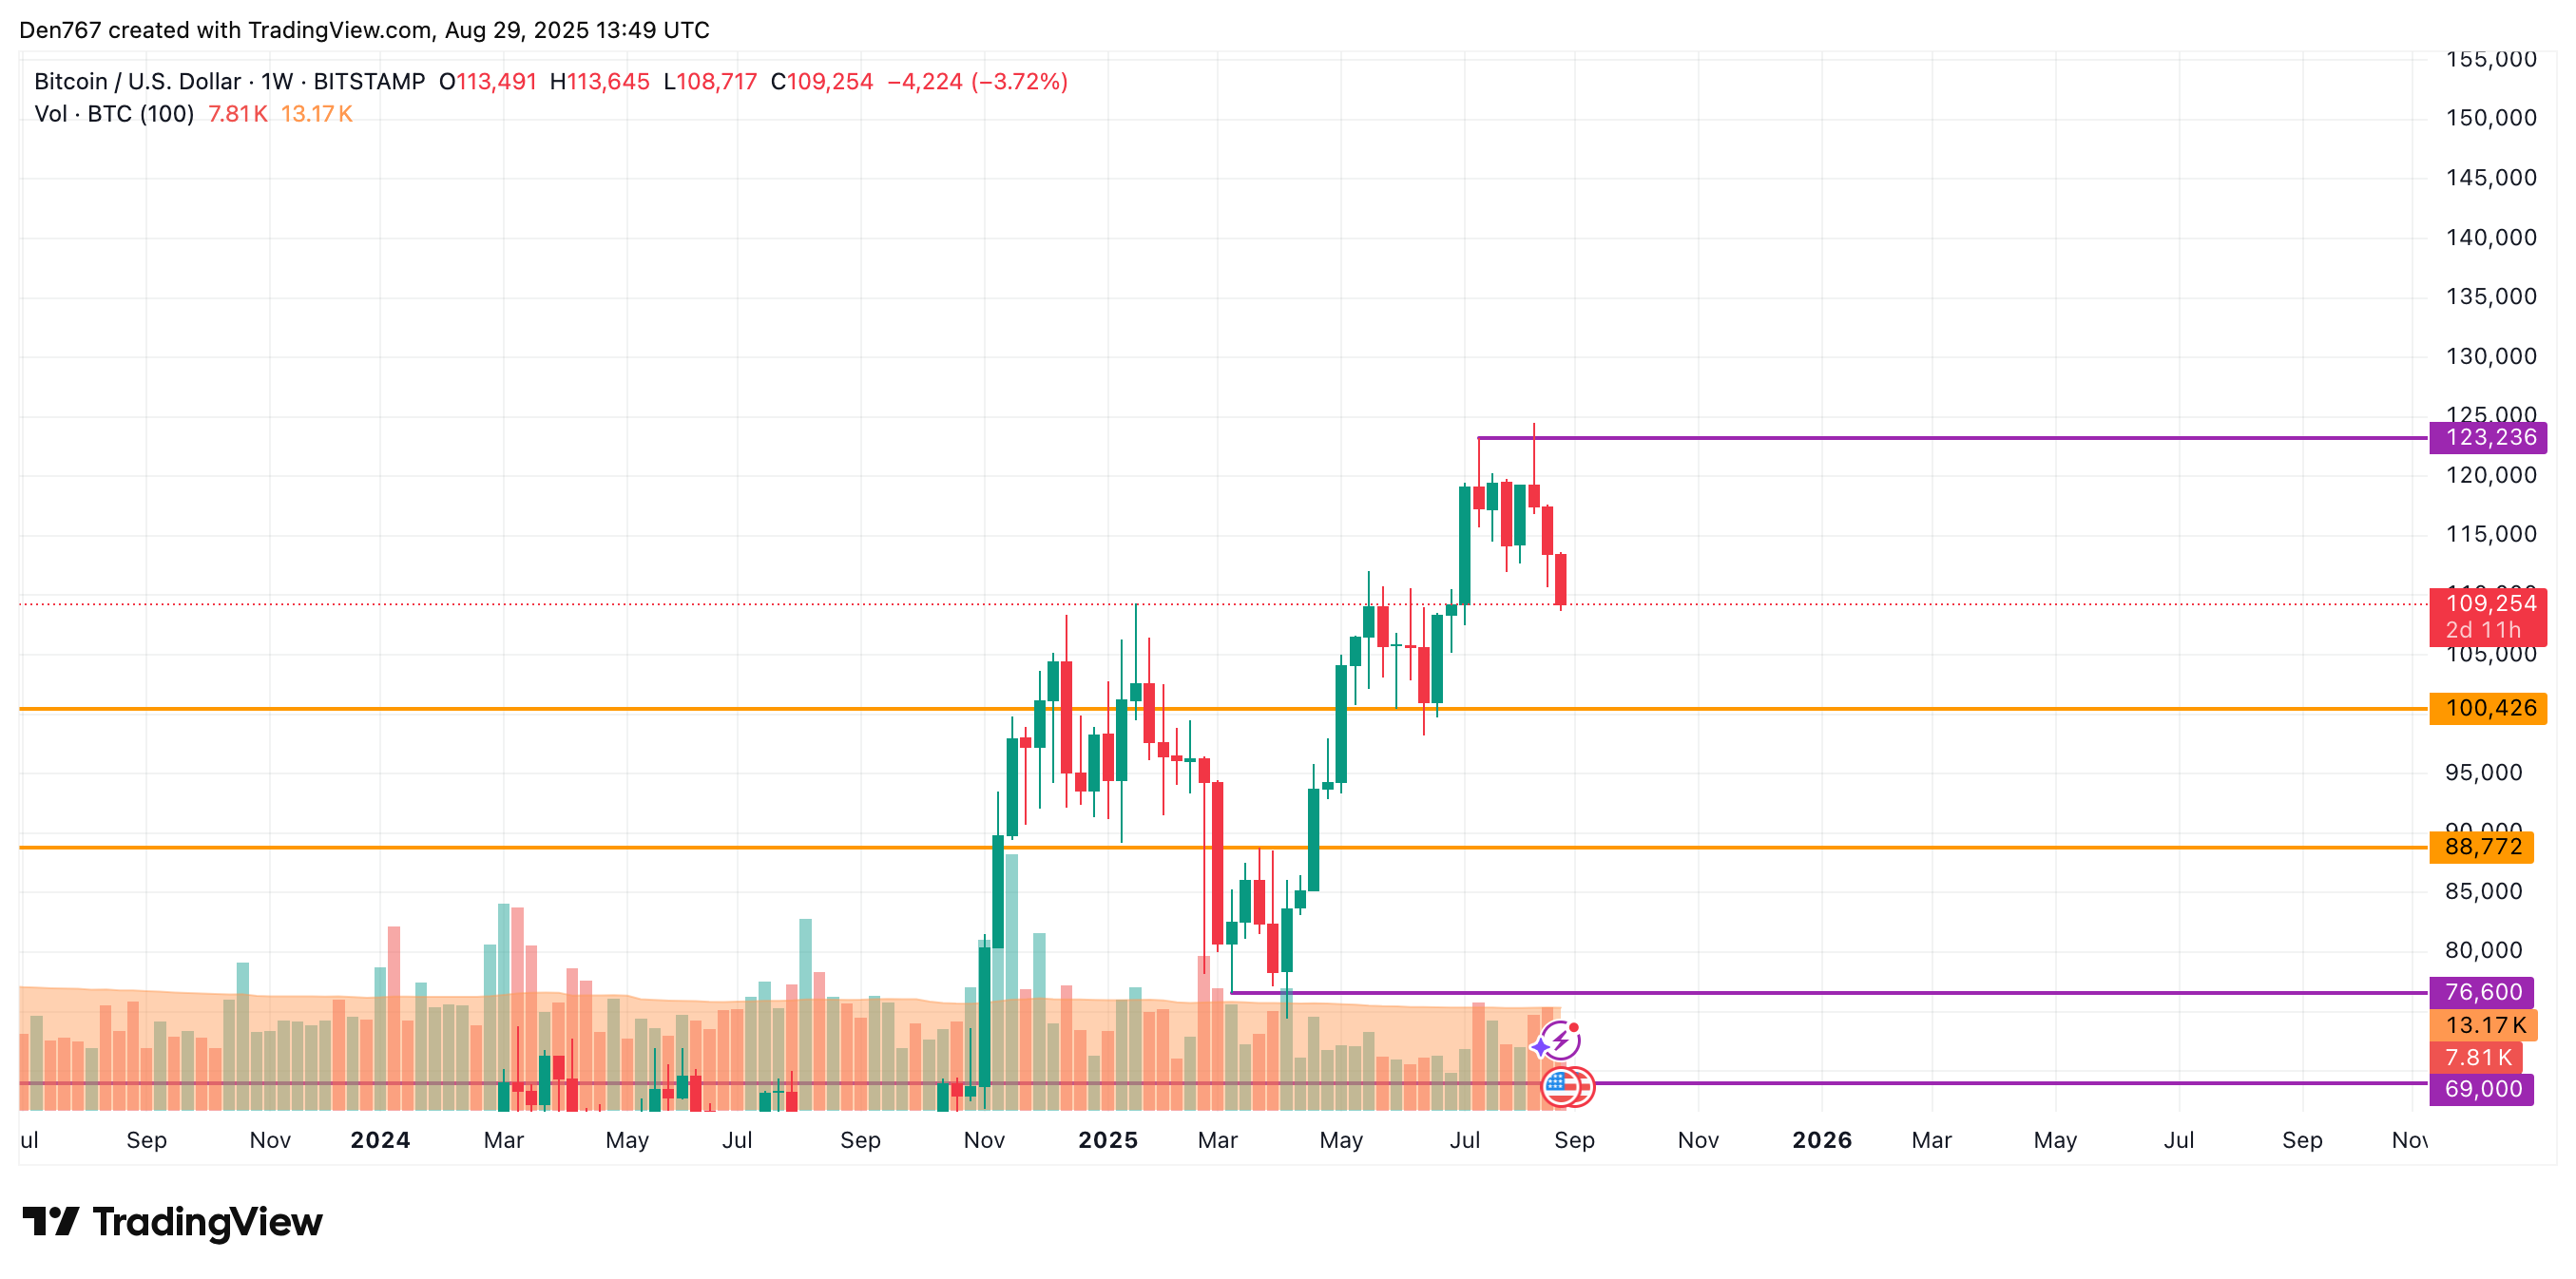
From the midterm point of view, there are no reversal signals yet. If bulls lose the interim zone of $110,000, traders may witness a test of the $100,000-$105,000 range shortly.
Bitcoin is trading at $109,254 at press time.